Lesson 17.2: Population Dynamics
Lesson 17.2: Population Dynamics
Lesson Objectives
Define population dynamics.
Describe exponential (J-curve) growth, and explain the conditions under which it oc- curs.
Explain Malthus’ ideas about human population growth and their significance to evo- lutionary theory.
Births and deaths: Balancing costs of reproduction and survival.
Clarify the relationship between population growth rate, birth rate, and death rate.
Compare trade-offs between survival and reproduction for altricial species to those of
precocial and nest parasite species.
Describe the relationship between age at maturity and growth rate.
Analyze the equation for population growth rate.
Describe several means of dispersal, and its importance to population density.
Define migration and explain possible effects on population density and growth.
Compare nomadism, irruption, range expansion, and colonization in terms of their effects on population density.
Give examples of population growth patterns in nature.
Describe logistic (S-curve) growth, and explain the conditions under which it occurs.
Analyze the concept of carrying capacity in terms of population growth and resource availability.
Compare and contrast density-dependent and density-independent limiting factors.
Relate predator-prey cycles to density-dependent population control.
Compare and contrast the adaptations and environmental characteristic of r-selected species to those of K-selected species.
Introduction
Imagine a huge bowl of your favorite potato salad, ready for a picnic on a beautiful, hot, midsummer day. The cook was careful to prepare it under strictly sanitary conditions, using fresh eggs, clean organic vegetables, and new jars of mayonnaise and mustard. Familiar with food poisoning warnings, s/he was so thorough that only a single bacterium made it into that vast amount of food. While such a scenario is highly unrealistic without authentic canning, it will serve as an example as we begin our investigation of how populations change, or population dynamics. Because potato salad provides an ideal environment for bacterial growth, just as your mother may have warned, we can use this single bacterial cell in the potato salad to ask:
How Do Populations Grow Under Ideal Conditions?
Given food, warm temperatures, moisture, and oxygen, a single aerobic bacterial cell can grow and divide by binary fission to become two cells in about 20 minutes. The two new cells, still under those ideal conditions, can each repeat this performance, so that after 20 more minutes, four cells constitute the population. Given this modest doubling, how many bacteria do you predict will be happily feeding on potato salad after five hours at the picnic? After you’ve thought about this, compare your prediction with the “data” in Table ??.
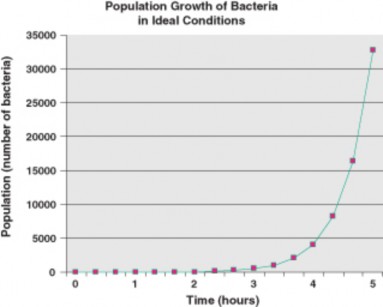
Table 17.2: Like many populations under ideal conditions, bacteria show exponential or geometric growth. Each bacterium can undergo binary fission every 20 minutes. After 5 hours, a single bacterium can produce a population of 32,768 descendants.
(Source: CK-12 Foundation, License: CC-BY-SA)
Are you surprised? This phenomenal capacity for growth of living populations was first described by Thomas Robert Malthus in his 1798 Essay on the Principle of Population. Al- though Malthus focused on human populations, biologists have found that many populations are capable of this explosive reproduction, if provided with ideal conditions. This pattern of growth is exponential, or geometric growth: as the population grows larger, the rate of growth increases. If you have worked compound interest problems in math or played with numbers for estimating the interest in your savings account, you can compare the growth of a population under ideal conditions to the growth of a savings account under a constant rate of compound interest. The graph in Figure 17.9, using potato salad bacterial “data,” shows the pattern of exponential growth: the population grows very slowly at first, but more and more rapidly as time passes.
Of course, if bacterial populations always grew exponentially, they would long ago have covered the Earth many times over. While Thomas Malthus emphasized the importance of exponential growth on population, he also stated that ideal conditions do not often exist in nature. A basic limit for all life is energy. Growth, survival, and reproduction require energy. Because energy supplies are limited, organisms must “spend” them wisely. We will end this lesson with a much more realistic model of population growth and the implications of its limits, but first, let’s look more carefully at the characteristics of populations which allow them to grow.
Births and Deaths: Balancing Costs of Reproduction and Survival
The growth rate of a population is the change in population size per member of the population per unit of time. The symbol r denotes growth rate. Growth rate clearly depends on birth rate b, the number of births per individual within the population per unit of time, as well a death rate d, the number of deaths per individual per unit of time. The following equation calculates growth rate, according to our preliminary understanding:
r = b – d
growth rate = birth rate – death rate
If birth rate exceeds death rate, r is positive and the population grows. If death rate exceeds birth rate, r is negative and the population declines. And if birth rate and death rate are in equilibrium, growth rate is zero, and the population remains stable. In a stable population, each individual, on the average, produces one offspring which survives long enough to reproduce itself. Mere survival is not success in the game of life; natural selection requires that survivors reproduce. As Malthus realized, nearly all species have the potential to grow – to reproduce many more than just a single replacement offspring. However, species vary in the strategies they use to achieve reproductive success, making trade-offs between the energy and time “costs” of survival and those of reproduction. Age at first reproduction, frequency of reproduction, number of offspring, parental care, reproductive lifespan, and offspring death rate are some of the traits which build strategies for successful reproduction.
Analyzing extreme examples can help you understand the trade-offs species must make between survival and reproductive success. Let’s compare two groups of birds. Somewhat like precocious children who mature early, precocial birds run around to find their own food soon after hatching. Geese, ducks, and chickens use this strategy for raising their young (Figure 17.10). Often living and nesting on the ground, precocial species are subject to high predation rates, so few survive long enough to reproduce. Therefore, those who do reproduce lay many eggs at once, and these eggs are large. The young emerge well-developed, ready to feed and escape predators soon after hatching. Precocial species invest a great deal of energy in a large number of offspring but do not spend much energy on parental care, because even though some offspring are likely to die, others will survive long enough to reproduce.
Contrast this precocial strategy with the opposite, altricial strategy used by robins and hummingbirds (Figure 17.11). These birds hatch helpless and naked, completely unprepared for independent life. Parents invest little energy in just a few, small eggs; hummingbirds’ eggs are the smallest in the bird world, and average two per nest. However, survival of these offspring matters a great deal, because there are so few. So, parents build elaborate nests safely hidden in trees and invest a great deal of energy hunting for food around-the-clock until the young have developed enough to fledge and find food on their own.
Precocial and altricial birds play by the rules of costs and benefits, each group using a
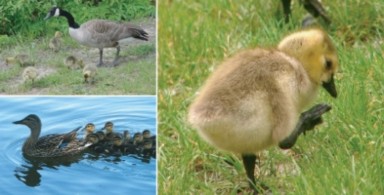
Figure 17.10: Geese and ducks use a precocial strategy to ensure reproductive success. They invest a great deal of energy in a large number of large eggs, so that young are born well- developed and ready to fend for themselves almost immediately after hatching. Predation on goslings and ducklings is high, but this death rate is offset by a high birthrate. Overall, the population remains stable. (8)
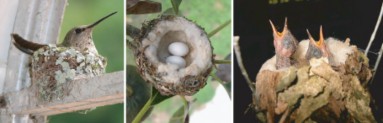
Figure 17.11: Hummingbirds illustrate an altricial reproductive strategy. Very little energy is spent to produce two tiny eggs, but they are enclosed in a secluded nest, usually hidden in a tree. Survival of the offspring is critical because there are only two, so parents invest tremendous amounts of energy finding food for themselves and their young for nearly three weeks. This energy investment allows the offspring to develop to nearly adult size before they fledge into the world of predators and competition. (15)
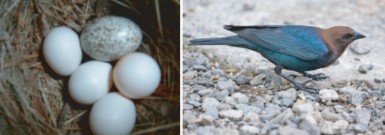
different strategy. Cowbirds, however, make up their own rules, earning them the title of “parasites” in the bird world. How can a bird be a parasite? Cowbirds are altricial, but they parasitize by laying their eggs in other birds’ nests, thereby escaping the high costs of parental care (Figure 17.12). Cowbird eggs are usually slightly larger and hatch a little sooner than the host eggs affording cowbird parents a bit of extra energy. “Early bird” hatchlings do indeed “get the worm,” easily out-competing their smaller host siblings for parental food deliveries. Sometimes, they are strong enough to ungratefully oust their “sibs” from the nest. On the other hand, host parents occasionally recognize and eject the foreign egg before it hatches. Yellow warblers simply block off the offending egg (along with their own eggs) by building a new nest bottom. They then lay a new clutch of their own eggs (The eggs are not their primary energy investment). A five-“story” nest holds the record for yellow warbler (and cowbird?) determination!
Many species fall in between the extremes of precocial and altricial strategies, but all must make trade-offs between the costs of reproduction and those of surviving predation, competi- tion, and disease, in order to ensure that at least one offspring per adult survives long enough to reproduce. It’s worth reprising the survivorship curves introduced in the previous lesson to illustrate these trade-offs (Figure 17.13). Which curve illustrates the precocial strategy used by ducks, chickens, and grouse? Which curve demonstrates the altricial strategy of robins and hummingbirds? What shape do you think a cowbird’s survivorship curve might take?
One more strategy, introduced in the last lesson, involves variation of age at maturity. All other factors being equal (number and size of offspring, survival rates, and more), delayed reproduction lowers population growth rate. Bald eagles require five years of growth before they are able to reproduce. If they were to lay the same number of eggs during their first year, those first-year offspring and several generations of their offspring, as well as the parents, would be able to reproduce during that time, tremendously increasing the overall population. By delaying reproduction, bald eagles not only ensure good energy supplies for reproduction at maturity, but also limit population density to suit their large bodied, long-lived life history.
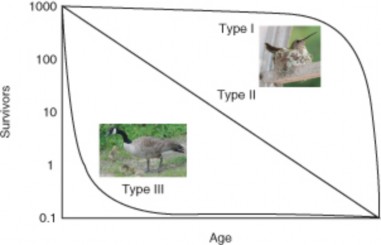
Figure 17.13: Survivorship curves show the various strategies for achieving population growth by adjustments in birth rate and death rate. Recall that r = b – d. Hummingbirds have low birth rates (b), but through time and energy spent on parental care and feeding, ensure high survival rates for their altricial offspring (low d). Geese, however, invest energy in many large eggs (high b) to offset high death rates from predation (d) among their precocial offspring. (4)
Migration and Other Movements Affect Population Densi- ties
Populations change not only through births and deaths, but also via immigration, move- ment of individuals into a population from other areas, and emigration, movement of individuals out of a population. If we add per capita rates of immigration and emigration into our equation for population growth rate, it becomes:
r = (b + i) – (d + e)
growth rate = (birth rate + immigration rate) – (death rate + emigration rate)
Many kinds of movement adaptations regularly add to or subtract from population density.
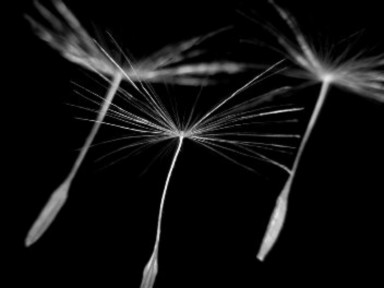
Most species have some means of dispersal – movement of offspring away from the parents. This “behavior” reduces competition within the population, promotes colo- nization of suitable habitat, and improves reproductive success. Some dispersal mech- anisms take advantage of natural energy in the environment. For example, dandelion seeds grow “parachutes” which allow wind to carry them far from their parents – and sometimes entirely out of a population (Figure 17.14). For the same reason, immobile animals such as corals often produce motile larva. Mobile animals often evolve behav- iors which ensure dispersal. A lone gray wolf which leaves its birth pack must find a mate and an unoccupied territory in order to reproduce; within the pack, usually only the alpha male and female have offspring. Dispersal behaviors are common in the living world; have you - as a teenage high school student, begun to feel stirrings of the wish to leave home?
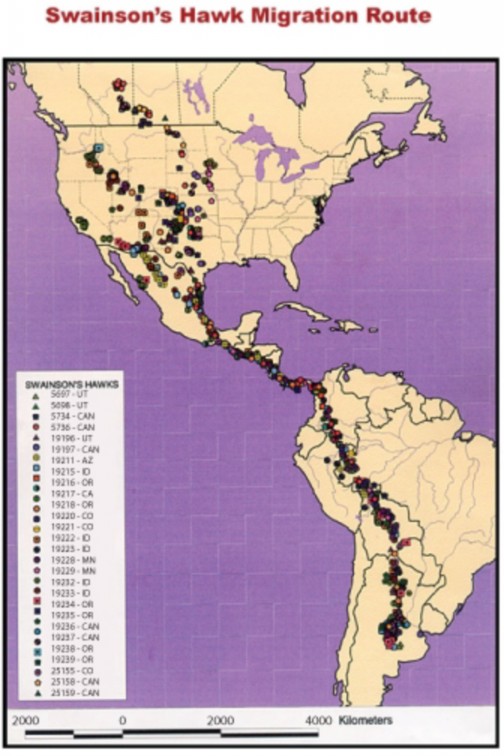
Migration, the direct, often seasonal movement of a species, is a predictable change for some animal populations. Many northern hemisphere birds, such as Swainson’s Hawks (Figure 17.15), migrate thousands of miles southward in the fall and return north to nest in the spring in order to follow summer’s long days which provide extra hunting time and a greater abundance of food.
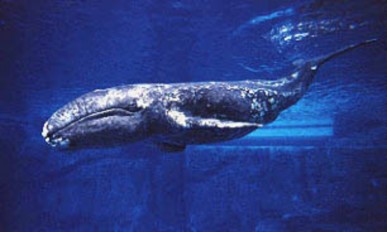
Apparently, energy benefits outweigh costs for this annual long-distance commute. Elk migrate vertically – up the mountains in spring as snow recedes and down the mountains in fall as winter advances. Monarch butterflies migrate in “shifts”; somewhat like a relay team, successive generations divide the task of moving from Mexican wintering grounds to northern summer habitats. Such migrations do not add to or subtract from populations as much as they move entire populations from one set of boundaries and environmental conditions to another. Some species, such as Peregrine Falcons, have both migratory and non-migratory forms, so their populations may grow or decline with migration. Gray Whales migrate 12,500 miles from Alaska to Mexico for calving, but at least one population limits its northward journey to the Oregon coast (Figure 17.16). Seasonal densities of migratory species vary
822
Figure 17.15: Entire populations of Swainson’s Hawks migrate annually from North America wtowSwo.uctkh12A.omrgerica and back. Migration can affect all four factors of the growth rate equation: rates of birth, death, immigration, and emigration. (3)
considerably, but resources and environmental benefits vary as well. Migration can affect all four factors of the growth rate equation.
Other types of movement are less predictable, but still may affect population growth.
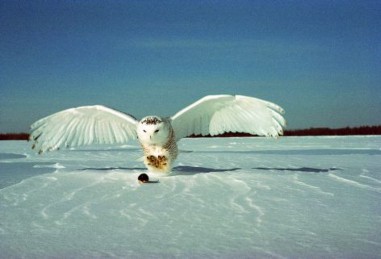
Nomadism, regular, wide-ranging wandering behavior, allows some species to com- pensate for fluctuating food sources. Normally arctic species, Snowy Owls occasionally venture as far south as Texas, southern Russia, and northern China (Figure 17.17). Bohemian waxwings are notoriously nomadic, feeding on highly variable berry supplies.
Irruptions or invasions are irregular movements, often caused by food source failures. Owls such as Great Grays and Boreals occasionally invade northern US states from their Canadian homes when rodent populations decline. Some may remain to nest following such an irruption.
Range expansion involves the gradual extension of a population beyond its original boundaries. Recent examples in the US include Cardinals, now common in northern areas where they were originally absent. The Swainson’s Thrush follows an indirect and unnecessarily long migration path - retracing, scientists believe, a range expansion from 10,000 years ago. Intentional introductions of non-native species such as the House Sparrow and reintroductions of extirpated species such as Peregrine Falcons throughout the Eastern US are human-initiated colonizations, which are often followed by range expansions.
Closely related to range expansion is colonization, but the latter often involves newly created, or at least newly found, habitats. Illustrating both range expansion and
colonization, the small red-eyed dragonfly spread throughout Europe in the late 20th century and colonized Britain in 1999 (Figure 17.18).
How Do Populations Grow in Nature?
You learned above that populations can grow exponentially if conditions are ideal. While exponential growth occurs when populations move into new or unfilled environments or rebound after catastrophes, most organisms do not live in ideal conditions very long, if at all. Let’s look at some data for populations growing under more realistic conditions.
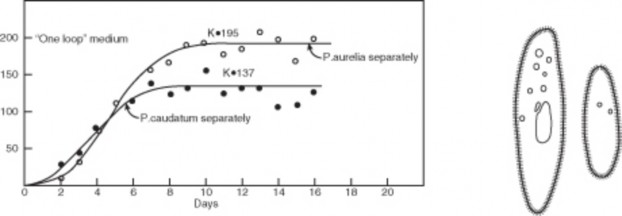
Biologist Georgyi Gause studied the population growth of two species of Paramecium in laboratory cultures. Both species grew exponentially at first, as Malthus predicted. However, as each population increased, rates of growth slowed and eventually leveled off. Each species reached a different maximum, due to differences in size of individuals and space and nutrient needs, but both showed the same, S-shaped growth pattern. Figures 17.19, 17.20, and 17.21 show this growth pattern graphically as an S-shaped curve.
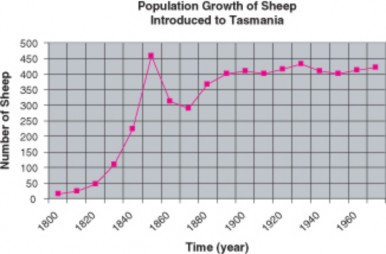
Perhaps even more realistic is the growth of a sheep population, observed after the introduc- tion of fourteen sheep to the island of Tasmania in 1800. Like the lab Paramecia, the sheep population at first grew exponentially. However, over the next 20 years, the population sharply declined by 1/3. Finally, the number of sheep increased slowly to a plateau. The general shape of the growth curve matched the S-shape of Paramecium growth, except that the sheep “overshot” their plateau at first.
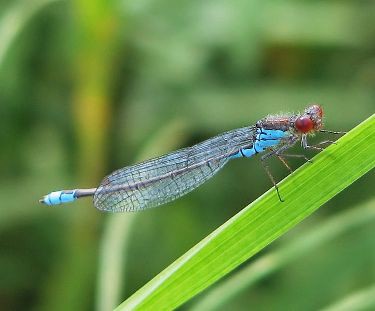
Figure 17.18: Small red-eyed dragonflies expanded their range throughout northwest Europe in the late 20th century and colonized Britain in 1999. (35)
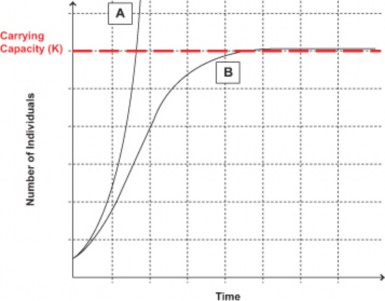
As Malthus realized, no population can maintain exponential growth indefinitely. Inevitably, limiting factors such as reduced food supply or space lower birth rates, increase death rates, or lead to emigration, and lower the population growth rate. After reading Malthus’ work in 1938, Pierre Verhulst derived a mathematical model of population growth which closely matches the S-curves observed under realistic conditions. In this logistic (S-curve) model, growth rate is proportional to the size of the population but also to the amount of available resources. At higher population densities, limited resources lead to competition and lower growth rates. Eventually, the growth rate declines to zero and the population becomes stable.
The logistic model describes population growth for many populations in nature. Some, like the sheep in Tasmania, “overshoot” the plateau before stabilizing, and some fluctuate wildly above and below a plateau average. A few may crash and disappear. However, the plateau itself has become a foundational concept in population biology known as carrying capacity (K). Carrying capacity is the maximum population size that a particular environment can support without habitat degradation. Limiting factors determine carrying capacity, and often these interact. In the next section, we will explore in more detail the kinds of factors which restrict populations to specific carrying capacities and some adaptations that limit growth.
Limits to Population Growth
A limiting factor is a property of a population’s environment – living or nonliving – which controls the process of population growth. Biologists have identified two major types of limiting factors: Density-dependent factors and Density-independent factors.
Density-dependent factors promote intraspecific competition – competition be- tween members of the same population for the same resource – as the population grows and becomes more crowded. Density-dependent limiting factors have the potential to control population size. Consider food supply as an example. When population den- sity is low, amount of food per individual is high, and birth rates are high. As density increases, food supply per individual decline and birth rates drop, causing growth rate to decline. Eventually, food shortages may lead to increased death rates and a neg- ative growth rate, lowering population size. Lower population size means more food per individual, and the population begins to grow again, reaching or temporarily over- shooting the carrying capacity. Food supply in this instance is a regulatory limiting factor, because it keeps the population at equilibrium. Density-dependent limiting factors may include:
Light
Water, nutrients/minerals, or oxygen
Waste, or the ability of an ecosystem to recycle nutrients and/or waste
Predation by predators which feed preferentially on more abundant prey
Disease and/or parasites
Space, with or without territorial behaviors, or nesting sites
Temperature
Aggressive behaviors, often combined with stress and effects on immune systems
Let’s look at two examples in detail, to emphasize the importance of density-dependent reg- ulation of growth. First, waste products build up with increasing population density. Most environments have some capacity for recycling of wastes, but sometimes rapid population growth means that natural environmental systems can’t keep up. An interesting - if not completely natural - example is the growth of yeast populations through fermentation in the making of wine. Alcohol is a waste product for the yeast, even though it is the point of the process as far as we’re concerned. As the yeast population grows, alcohol builds up; but alcohol is toxic – to yeast as well as to humans – and after the concentration reaches 13%, increased death rates doom the yeast population. Therefore, no naturally fermented wine contains more than 13% alcohol.
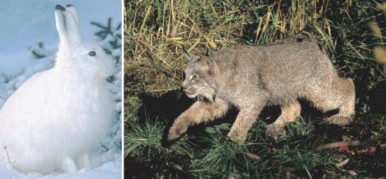
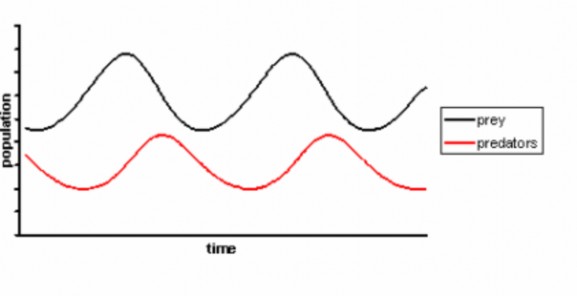
A second density-dependent limiting factor is predation. Predators kill and eat their prey, of course, so predation increases prey death rate and can cause negative growth rates – population decline. If predators have multiple types of prey, and switch their feeding to specific prey only when they are abundant, predators may regulate prey population size. However, especially in northern climates, predators often specialize on a single prey species. Goshawks, for example, feed primarily on ruffed grouse, and Canada Lynx depend on snowshoe hares (Figure 17.22). If predation causes a significant decline in the prey population, starving predators may experience their own (delayed) decrease in population as a result of lower birth rates or increased death rates. The result is apredator-prey cycle; both populations rise and fall, with predator populations trailing prey (Figure 17.23).
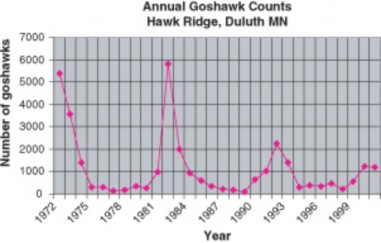
Goshawks play the game with a little twist; when ruffed grouse populations in their Canadian conifer forest homes decline, they migrate southward. Grouse populations show ten-year cycles; note that the goshawk counts from Hawk Ridge in Duluth, Minnesota show ten-year “invasions” which correspond to prey population lows in Canada (Figure 17.24).
All of these factors have the potential to lower birth rates or increase death/emigration rates via increased intraspecific competition at higher population densities. Many natural populations are kept at or below carrying capacity by one or a complex interaction among several of the above limiting factors.
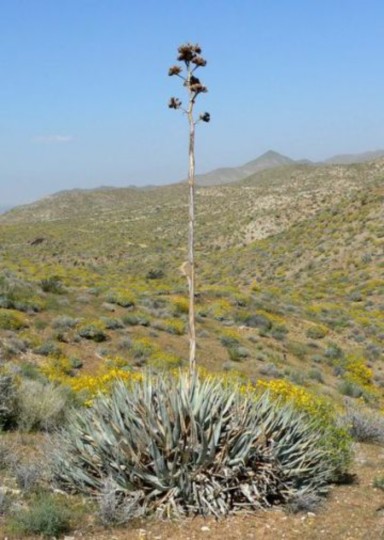
Density-independent factors can also limit populations, but they seldom regulate populations because they act irregularly, regardless of the population’s density. Popu- lations limited by density-independent factors seldom reach carrying capacity. Weather is a good example. Agaves (Century Plants) reproduce once at the end of a long lifes- pan (Figure 17.25). The average lifespan is about 25 years rather than a full century, but an individual’s lifespan depends at least in part on erratic rainfall. Agaves will reproduce only after rainfall allows sufficient growth – however long that takes. Even- tually, a wet season will bring about a single episode of flowering and the production of a huge number of seeds. Their growth and eventual reproduction will, in turn, depend on erratic rainfall. The density-independent factor rainfall limits birth rate, which in turn limits growth rate, but because of its unpredictability, it cannot regulate Agave populations.
Other density-independent limiting factors include human activities:
Pesticides and herbicides: For example, DDT thinned the eggshells of Peregrine Fal- cons, reducing their birthrates and leading to their extirpation from the eastern half of North America.
Habitat destruction: Conversion of prairies and grasslands worldwide drastically re- duced populations of Burrowing Owls in North America and Giant Pandas in China.
To conclude our discussion of population dynamics, let’s look at two sets of adaptations related to the logistic growth curve which describe the growth of most populations. These should remind you of the survival patterns we discussed earlier in this lesson. Recall that for logistic growth, r is the growth rate of the population, and K is the carrying capacity.
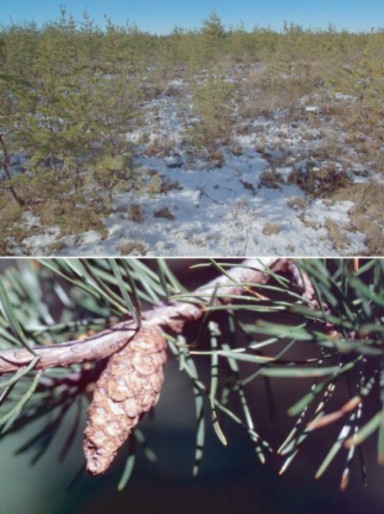
Scientists have found that species adapted to unstable or unpredictable environments are usually limited by density-independent factors to population densities considerably lower than carrying capacity. Such environments favor adaptations which maximize growth rates: early maturity, small size, high numbers of small offspring, single episodes of reproduction, short life expectancy, and the ability to disperse widely. Because pop- ulations are usually far below carrying capacity, crowding is minimal, so these species invest little energy in competitive adaptations. Survivorship curves (Figure 17.13) are Type III, with high early death rates. Such species are said to be r-selected – that is, selected for rapid growth. Weed species are often r-selected for colonization and rapid population of disturbed or newly created habitats such as roadsides, abandoned fields, mudslides, or lava flows. Jack pine trees are r-selected species which “pioneer” clear areas immediately after forest fires. They grow quickly in hot, dry soils and release seeds from cones which are opened only by fire – reproducing and dispersing seeds at just the right, if unpredictable, time (Figure 17.26).
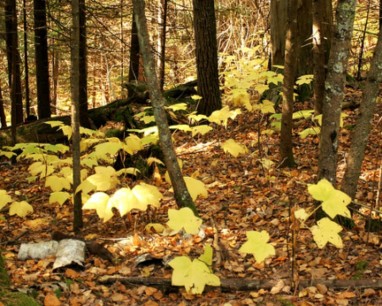
Whereas density-independent factors limit r-selected species in unpredictable envi- ronments, K-selected species are adapted to stable environments and regulated by density-dependent factors. Stable environments support K-selected populations at or near carrying capacity, at which point crowding leads to significant intraspecific com- petition. Such environments favor adaptations for efficient resource utilization which confer competitive ability. K-selected individuals often grow slowly to large size, live long, and delay but repeat reproduction of fewer offspring. They may provide exten- sive parental care because they can count on environmental stability and survival of these relatively few offspring. Survivorship curves resemble the Type I pattern: long life expectancy and relatively low death rates in the stable environment. Maple trees are K-selected “climax” species which grow slowly in their own shade and reproduce relatively large seeds over a number of years throughout their relatively long lifespan (Figure17.27).
Characteristics of r-selected and K-selected species are compared in Table 17.3.
r- Selected Species K-Selected Species
Environment Unstable Stable
Type of Regulating Fac- tors
Density-independent Density-dependent
Table 17.3: (continued)
r- Selected Species K-Selected Species
![]()
Organism Size Small Large
Maturity Early Late
Number of Offspring Many Few
Energy used to make each Individual
Low High
Average Life Expectancy Short Long
Number of Reproductive Events per Individual
Once Many times
Survivorship Type III: only a few individ-
uals live long lives
Type I or II: most individu- als live long lives
In conclusion, all populations eventually reach limits, at or below carrying capacities for the ecosystems in which they live. Some have adaptations for rapid growth, but the unpredictable environments in which they live inflict high death rates. Others live in stable environments where death rates are relatively low, but their populations are high, so individuals must spend energy on costly competitive strategies in order to gather scarce sunlight, nutrients, or water - or fight disease or predation. Many species live between these extremes, but all populations have limits.
Lesson Summary
The ways in which populations change are called population dynamics.
Populations have the potential to grow exponentially, at least under ideal conditions.
Exponential growth begins with slow growth, but as population increases, growth rate increases.
J-curves depict the pattern of exponential population growth.
Malthus first described exponential growth for the human population and predicted that humans would outgrow their food resources, leading to widespread famine or war.
If birth rate (plus immigration) exceeds death rate (plus emigration), a population grows. If death rate exceeds birth rate, the population declines. And if birth rate and death rate are in equilibrium, growth rate is zero and the population remains stable.
In a stable population, each individual (on the average) produces one offspring which survives long enough to reproduce itself.
Altricial species have a few undeveloped offspring but invest a great deal of energy in parental care. Precocial species invest energy in a large number of well-developed offspring, but little in parental care.
The earlier species begin to reproduce, the faster their population grows, with all other factors being equal.
Dispersal moves offspring away from parents, reducing intraspecific competition.
Migration, seasonal movement of populations, can affect all four components of popu- lation growth rate.
Regular wandering behavior (nomadism) adapts specific populations to fluctuating food supplies.
Irruption, range expansion, and colonization have irregular, unpredictable effects on population growth.
Few populations in nature grow exponentially. No population can continue such growth indefinitely.
The logistic (S-curve) model best describes the growth of many populations in nature.
In the logistic model, growth rate depends on both population size and availability of resources. Growth is slow at first, but as size increases, growth accelerates. At higher densities, limited resources cause growth rate to decline, and populations stabilize at carrying capacity.
A limiting factor is a property of a population’s environment which restricts population growth.
Density-dependent limiting factors lower birth rates or increase death/emigration rates via increased intraspecific competition at higher population densities.
Many natural populations are kept at or below carrying capacity by one or a complex interaction among several density-dependent limiting factors, such as competition, pre- dation, or disease.
Density-independent factors, such as rainfall, drought, or pollution, can also limit pop- ulations, but they seldom regulate populations because they act irregularly, regardless of the population’s density.
Cycles of growth and decline limit some predator and prey populations.
Density-independent factors limit r-selected species in unpredictable environments, while K-selected species are adapted to stable environments and regulated by density- dependent factors.
Review Questions
Further Reading / Supplemental Links
Explain Malthus’ ideas about population growth and their significance to evolutionary theory.
Compare exponential(J-curve)growth to logistic(S-curve)growth, and explain the con- ditions under which each occurs in nature.
Summarize the equation for population growth rate, and explain each factor.
Compare survival and reproduction in altricial species to the same factors for precocial
species.
How might delaying age of childbirth prevent the need to limit family size, as China has done?
Give examples of dispersal and migration, and how they affect populations.
Define carrying capacity and explain its importance to population growth.
Compare and contrast density-dependent and density-independent limiting factors.
Relate predator-prey cycles to density-dependent population control.
Compare and contrast the adaptations and environmental characteristics typical of r-selected species to those of K-selected species.
http://www.estrellamountain.edu/faculty/farabee/biobk/BioBookpopecol.html
http://www.geography.learnontheinternet.co.uk/topics/popn1.html
http://curriculum.calstatela.edu/courses/builders/lessons/less/biomes/breeding. html
http://www.bestfootforward.com/
http://www.footprintnetwork.org/gfn_sub.php?content=footprint_overview
http://www.panda.org/news_facts/publications/living_planet_report/index. cfm
http://www.worldchanging.com/archives/006904.html
http://lca.jrc.ec.europa.eu/lcainfohub/introduction.vm
http://www.ilea.org/leaf/richard2002.html
Vocabulary
altricial Refers to a pattern of growth and development in organisms which are incapable of moving around on their own soon after hatching or being born.
birth rate (b) Number of births within a population or subgroup per unit time; in human demography, the number of childbirths per 1000 people per year.
carrying capacity (k) The maximum population size that a particular environment can support without habitat degradation.
colonization Movement of a population into a newly created or newly found area.
death rate (d) Number of deaths within a population or subgroup per unit time; in human demography, the number of deaths per 1000 people per year.
density-dependent factor Factor which has the potential to control population size be- cause its effects are proportional to population density.
density-independent factor Factor which may affect population size or density but can- not control it.
dispersal Movement of offspring away from parents, resulting in reduced competition within the population and more effective colonization of suitable habitat.
emigration (e) Movement of individuals out of a population’s range.
exponential model (geometric or J-curve) A model of population growth which as- sumes that growth rate increases as population size increases.
immigration (i) Movement of individuals into a population’s range from other areas.
intraspecific competition Competition between members of the same population for the same resource.
irruption (invasion) Irregular movements, often caused by food source failures.
K-selected species A species which has adaptations which maximize efficient utilization of resources, conferring competitive strength near or at carrying capacity.
limiting factor A property of a population’s environment – living or nonliving – which controls the process of population growth.
logistic (S-curve) A model of population growth which assumes that the rate of growth is proportional to both population size and availability of resources.
migration The direct, often seasonal movement of a species or population.
nomadism Regular, wide-ranging wandering behavior, which allows some species to com- pensate for fluctuating food supplies.
population A group of organisms of a single species living within a certain area.
population dynamics Changes in population size and structure.
population growth rate (r) The change in population size per member of the population per unit time.
precocial Refers to species in which the young are relatively mature and mobile from the moment of birth or hatching.
predator-prey cycle Regular, repeating increases and decreases in a prey population fol- lowed by corresponding changes in its predator’s population.
elected species Species which has adaptations which maximize growth rate, r.
range expansion The gradual extension of a population beyond its original boundaries.
Points to Consider
Why do you think Malthus’ predictions of widespread famine and war have not (yet?) been realized? Do you think his ideas make sense for the future?
Are humans altricial or precocial? Why?
In your opinion, could delaying age of first childbirth help solve human population problems?
How important do you think dispersal, range expansion, or immigration are for human populations?
Do you think humans have more r-selected adaptations, or K-selected adaptations?
Do you think Earth has a carrying capacity for humans? If so, what kinds of limiting factors determine that carrying capacity?
- Log in or register to post comments
- Email this page