Lesson 17.3: Human Population Growth: Dooms- day, Cornucopia, or Somewhere in Between?
Lesson 17.3: Human Population Growth: Dooms- day, Cornucopia, or Somewhere in Between?
Lesson Objectives
Contrast the Neo-Malthusian or “limits to growth” and cornucopian or “technological fix” views of human population growth.
Compare the overall pattern of human population growth to the J-curve (exponential) and S-curve (logistic) models.
Analyze the factors which have influenced human population growth from our begin- nings 200,000 years ago to 1804, when we first reached the one billion mark.
Describe the four stages of human population growth as outlined by the demographic transition model.
Evaluate the demographic transition model as it applies to European population growth in the late 18th and 19th centuries.
Evaluate the demographic transition model as it applies to less developed countries.
Apply the demographic transition model to recent changes in developed countries.
Using age-sex structures, contrast population growth in developed countries to growth in undeveloped countries.
Explain the concept of replacement fertility rate.
Discuss the implications of Stage 5 population dynamics.
Know and understand predictions for future worldwide human population growth.
Analyze limiting factors and technological advances which may contribute to a carrying capacity of Earth for the human population.
Explore the concept of sustainability as a goal for economic, social, and environmental decision-making.
Explain the tool of ecological footprint analysis as a means of evaluating the sustain- ability of lifestyles for individuals, countries and the world.
Calculate your ecological footprint and compare it to averages for your country and the world.
Recognize our human potential to make decisions which could direct future population growth.
Explore some options for social, political and cultural change, and environmental con- servation which could help to balance population dynamics and resource utilization.
Introduction
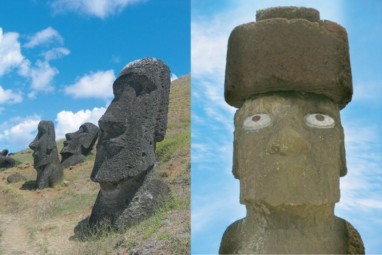
Hundreds of stone figures measuring up to 10 meters tall and weighing up to 87 tons overlook a low-diversity grassland on Easter Island in the Pacific Ocean (Figure 17.28). The food sources, woody trees, and rope-yielding plants which helped to build and transport these statues over five hundred years ago are gone.
Pollen analyses suggest that the island was totally forested at least until 1200 CE, but that by 1650 the forests had entirely disappeared. Middens (waste dump sites) show a sudden disappearance of sea bird and fish bones, suggesting that wood for canoes was no longer available. Sediments reveal that half of native plant species had become extinct. Later fire pits indicate the possibility of cannibalism.
Jared Diamond, in his book Collapse: How Societies Choose to Fail or Succeed, examines this bleak scene and other past societies and concludes that doomed civilizations share eight traits which contribute to their collapse. Seven of the eight traits are rooted in overpop- ulation relative to environmental carrying capacity. Diamond considers Easter Island to be “Earth writ small” – a warning that this island’s environmental devastation could fore- shadow a similar fate for our planet. He encourages humans to learn from earlier collapses to conserve the forest, soil, water, animal, fish, photosynthetic, atmospheric, and energy resources upon which our human lives depend. A large group of people sometimes known
as “Neo-Malthusians” join Diamond in his belief that human population growth cannot continue without dire consequences.
Julian Simon and a group dubbed “cornucopians” see the human condition differently. Named for the mythical Greek ”horn of plenty” which supplied endless food and drink mag- ically, cornucopians believe that the Earth can provide an almost limitless abundance of natural resources, that few natural limits to growth exist, and that technology can solve or overcome population-induced resource scarcity and environmental degradation. Larger hu- man population (within an appropriate political environment) is the answer to the problems of population growth, according to Simon.
Are you, like Diamond and Malthus before him, a “doomster”? Or do you join Simon as a “boomster”? Most “doomsters” and “boomsters” share the belief that we are responsible for managing problems related to population growth. Let’s use our understanding of popula- tion biology to study the human population. Our goal will be to shed light on the decisions we – the only species able to consider and alter our rates of birth and death – make about future population growth.
The past two lessons have shown how populations in nature grow. You have learned that all populations have the potential to grow exponentially (J-curve pattern of growth), but that exponential growth is limited to ideal conditions, which are rare in nature. In nature, com- petition for limited resources or unpredictable, density-independent limiting factors restrict populations to densities at or below carrying capacities (S-curve growth pattern). Some
populations grow smoothly to a stable carrying capacity, but others overshoot that density and may crash before rebuilding to a relatively stable level. A few crash to extinction. In unstable environments, some populations establish cycles of population growth and decline. Unstable environments favor adaptations for rapid growth (r-selected species), and stable environments favor adaptations for efficient use of resources (K-selected species).
Where do humans fit? Are we built for growth – or conditioned for efficient use of resources? Does our growth pattern resemble a J, or an S? Are we in danger of extinction? What exactly is our “population problem,” and what can we do to solve it?
Early Human Population Growth
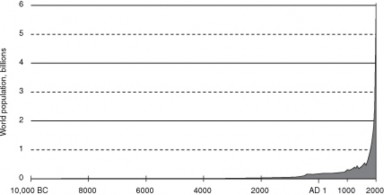
Let’s begin by looking at the data. Worldwide human population from 10,000 BCE through today is graphed in Figure 17.29. The theoretical J (exponential) and S (logistic) growth curves are reviewed in Figure 17.30. Overall, our growth resembles exponential growth (the J curve), increasing very slowly at first, but later growing at accelerating rates which show no sign of nearing carrying capacity. We appear to be r-selected for rapid growth; indeed, some have described humans as the most successful “weed species” Earth has ever seen as we are fast growing, rapidly dispersing, and colonize habitats from pole to pole. If Earth has a carrying capacity for humans, it is not yet visible in our growth curve – at least on this scale.
However, closer study of human population dynamics reveals more complexity. Different countries show different patterns of population growth today, and history shows varying patterns of growth across time. The history of human population growth can be divided into four stages. Today’s countries show snapshot views of these stages. In this section, we will look at early human population growth.
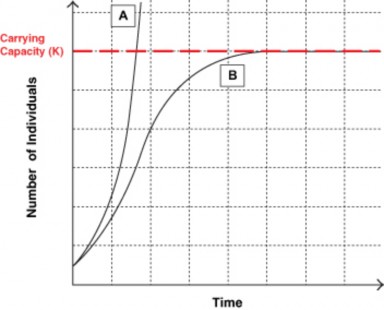
Figure 17.30: Growth of populations according to Malthus’ exponential model (A) and Ver- hulst’s logistic model (B). Both models assume that population growth is proportional to population size, but the logistic model also assumes that growth depends on available re- sources. A model’s growth under ideal conditions shows that all populations have a capacity to grow infinitely large. B limits exponential growth to low densities; at higher densities, competition for resources or other limiting factors inevitably cause growth rate to slow to zero. At that point, the population reaches a stable plateau, or the carrying capacity. (25)
As scientists currently understand human history, Homo sapiens arose about 200,000 years ago in Africa. Living as nomadic hunter-gatherers, we migrated to Eurasia and Australia about 40,000 years ago and into the Americas 30,000 years later. Throughout this period, both birth rates and death rates were probably high – as much as 5%. Our human popula- tion grew slowly as we spread throughout the world, out-competing other hominid species with our apparently superior reproductive and competitive adaptations. Ice ages, warming periods, and volcanic eruptions were density-independent factors which severely limited our population growth. For example, a “supervolcanic” eruption at Toba in Sumatra 74,000 years ago covered India and Pakistan with more than 5 feet of ash, causing 6 years of nu- clear winter, a thousand-year ice age, and the death of up to 99% of the humans living at the time!
With the invention of agriculture 10,000 years ago, we began to develop settled civilizations and trade. Disease associated with animal domestication and city living increased death rates, but reliable food supplies, shared childcare, and division of labor increased birth rates. These effects may have offset each other; slow and uneven growth probably continued. However, the development of agriculture, like many advances in technology, almost certainly raised carrying capacity.
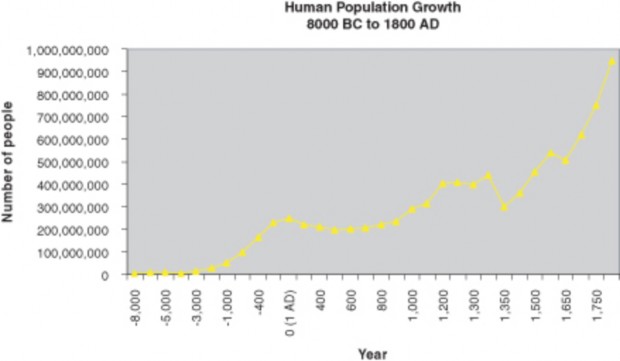
Beginning about 6000 years ago, political states evolved, cooperated or competed, and some- times waged war. Empires formed, connecting previously independent populations. In the Middle Ages, technology advanced, and the 17th century brought the Scientific Revolution. Throughout this long period of human history, death rates and birth rates continued to be high. Density-independent factors such as drought and the “little ice age” combined with density-dependent factors such as disease to keep death rates high and variable. The “black death” of the mid-fourteenth century killed as many as 75 million people world- wide and the disease is one of the very few events whose effects are visible in any graph of human population growth (Figures 17.29, 17.31). Birth rates continued at a high level throughout early human history. Carrying capacity rose with major advances in technology, as humans modified the environment by irrigating land, building cities, and transporting animals, plants, and products. The overall result was slow growth and a young population. By 1804 CE, the world’s human population had reached 1 billion.
Demographic Transition
Major changes in human population growth began during the 18th century, but they affected different regions at different times. We will first consider Europe, and later compare Europe to other regions of the world. In 18th century Europe, seed planters, improved ploughs, threshing machines, crop rotation, and selective breeding of animals led to major growth in food supplies, so death rates due to starvation declined. With increasing understanding of the causes of disease, people improved water supplies, sewers, and personal hygiene – and lowered death rates even more. The Industrial Revolution of the 19th century developed new sources of energy, such as coal and electricity. These further increased the efficiency of new
agricultural machines and promoted the development of new forms of transportation, mainly railroads, which improved distribution of food. Death rates fell – particularly for those 5 to 10 years of age, allowing many more children to survive to reproduce. The pattern of human survivorship shifted toward a Type III curve.
Although death rates fell, birth rates remained at earlier levels. The gap between birth and death rates increased, and population growth began to accelerate (remember that r = b – d). Although this change did not happen uniformly throughout the world, it was soon reflected in world population levels: it took 200,000 years for the human population to grow to 1 billion, but only 123 years to grow to 2 billion!
Demographic transition theory holds that human populations pass through four stages of growth (Figure 17.32).
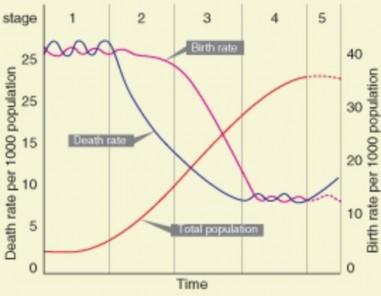
Early human history, with its slow, uneven growth maintained by high rates of birth and death, illustrates Stage 1 (Figure 17.31, but compare to section “1” of Figure 17.32).
Stage 2, just discussed for Europe, involves a significant drop in death rate not matched
by an increase in birth rate, resulting in an increasingly rapid rise in population – exponential growth.
In Stage 3, according to the theory, changes in technology and society lead to a decline in birth rate:
Eventually, according to demographic transition theory, falling birth rates approach already- diminished death rates, and population growth begins to level off.
The decline in child mortality and improvement in agriculture leads rural families to realize they no longer need to have as many children.
Agricultural improvements shift more people to urban areas and reduce the need for children.
Compulsory education removes children from the work force but adds to the cost of raising them.
Increasing education and employment of women reduces their time for and interest in having children.
Birth control methods expand.
Later marriage and delayed childbearing further lower birth rate.
In Stage 4, birth rates equal death rates, r = zero, and populations become stable.
This somewhat idealistic theory suggests that societies pass through predictable changes which lead to population growth patterns resembling the logistic or S curve. As we have seen (Figure 1), world population growth does not (yet?) show Stages 3 or 4. However, individual countries appear to be at different stages along the continuum; some have reached Stage 4 and a few even require the addition of a 5th stage.
Recent Population Growth
Death rates have fallen throughout the world, so that no country today is considered to remain in Stage 1. Countries appear to vary with respect to the timing of Stages 2 and 3. Many less developed countries remain in Stage 2, including Yemen, Afghanistan, Bhutan, Laos, and part of Sub-Saharan Africa.
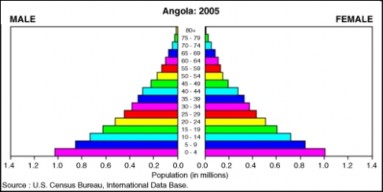
Angola’s age structure (Figure 17.33) reveals accelerating Stage 2 growth. Widest at its base, the structure indicates many youths who will survive to reproduce at their parents’ high fertility rates because death rates are declining. Some countries, particularly those in regions of Africa which have been devastated by AIDS, appear stalled in Stage 2 due to disease and stagnant development. The demographic transition model may not prove to fit population growth in developing countries. Poor, low-income people in undeveloped countries have the highest birth rates. If demographic transition requires wealth and edu- cation, the world’s unequal distribution of development and resources may mean that these high birth rates will merely maintain exponential growth, rather than precipitate the social change associated with industrialization.
However, many countries appear to have begun the shift to Stage 3. Fertility rates have dropped 40% throughout much of South America, the Middle East, and the Pacific Islands. Countries such as India, Bangladesh, and Zimbabwe have lowered birth rates between 25- 40%, and others such as Pakistan, Saudi Arabia, and Haiti have reduced fertility to 10-25% of earlier rates. Populations in most of these countries are beginning to level off, although resistance to change in the social factors which reduce birthrate may delay or prevent this response. Ecologist Garrett Hardin has pointed out that voluntary birth control selects against people who use it; by itself, voluntary control is unlikely to limit population growth.
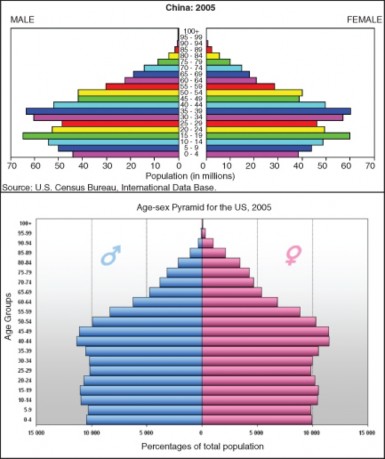
High levels of industrialization and development have led to replacement (or lower) fer- tility rates in most of Europe, the United States, Canada, Australia, Brazil, China, and Thailand. China, Brazil, and Thailand passed through demographic transition extremely rapidly due to rapid economic and social changes. Replacement fertility includes 2 children to replace parents and a fraction of a child to make up for early mortality and at-birth sex ratio differences. Because mortality rates vary, replacement fertility rate ranges from 2.5 to
3.3 in poor countries, but averages 2.1 in developed countries. Globally, replacement fertility is 2.33 children per woman. In Stage 3 countries, populations will eventually stabilize if re- placement fertility continues. However, many - including the US – continue to grow rapidly due to the “youth bulges” of exponential Stage 2 growth. The age structures of China and the US (Figure 17.34) show demographic transition, but also youth bulges which will mean continuing growth for some time.
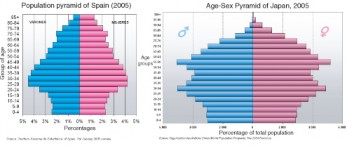
Some countries have lowered birthrates below death rates so that r is actually negative. Japan, Germany, Italy, Spain, Portugal, and Greece are not producing enough children to replace their parents; populations in some of the southern European countries have already begun to decline. Top-heavy age structures for Spain and Japan are shown in Figure
In countries such as Russia, negative growth emerged suddenly from economic and political crises which caused emigration, declining fertility, and increased male mortality, rather than from development and wealth as the transition model predicts. Negative growth rates pose economic threats: growth-dependent industries decline, and the burden of a large aging, economically dependent population falls on a smaller group of young workers. These shrinking population conditions are sometimes referred to as Stage 5 of the demographic transition.
Future Population Growth: Does Earth Have a Carrying Capacity for Humans?
As of September 2007, the world’s human population stood at about 6.7 billion, growing by 211,090 people each day. Historically, we didn’t hit the one-billion mark until 1804 (having begun 200,000 years earlier), but we needed just 12 years to grow by our last billion. Pro- jections by the United Nations and the U.S. Census Bureau predict that by 2050, Earth will host 9.4 billion people; other estimates project that the earth will host 10 to 11 billion peo- ple by 2050. See http://www.youtube.com/watch?v=4BbkQiQyaYc or click on the following World Population video .
Cornucopians welcome such growth, believing more people are better for technology and innovation. The demographic transition model predicts that when all nations are industrial- ized, the human population will eventually reach a stable level – a carrying capacity of sorts. However, many scientists believe that humans have already overshot the carrying capacity of Earth for our unique levels of resource exploitation and habitat alteration. They and other Neo-Malthusians predict that resource depletion and environmental degradation will eventually lead to famine, epidemics, or war – a Malthusian crisis.
Figure 17.36: A graphic description of world population growth from 1 A.D. World Popula- tion (Millenium Edition) was produced and copyrighted by Population Connection (formerly Zero Population Growth, Inc.) in 2000. Population Connection is a nonprofit, 501(c)(3) or- ganization. www.popconnect.org http://www.youtube.com/watch?v=4BbkQiQyaYc& feature=youtube_gdata
Does Earth have a carrying capacity for humans? Recall that carrying capacity is the maxi- mum population size that a particular environment can support without habitat degradation. Ideally, carrying capacity matches population size to resource availability. Although the hu- man population is clearly continuing to grow, many scientists believe that we over-consume resources and exceed the environment’s capacity to cycle nutrients and process waste. They believe that multiple factors will contribute to a crisis in which disease, starvation, or global conflict will cause a population crash or even extinction:
Our current agricultural system, globally transformed by the Green Revolution of the mid-20th century, depends heavily on nonrenewable fossil fuels for fertilizers, pesticides, and irrigation. Ecologist and agriculturalist David Pimentel predicts that to avert disaster, the U.S. must reduce its population to a maximum of 200 million (we are now above 300 million – see the “pop clock” Figure 17.37), and the world population must drop to 1/3 its current level. Distribution of food has long been a problem and today has some rather ironic consequences: A 2006 MSNBC report claimed, ”There are an estimated 800 million undernourished people and more than a billion considered overweight worldwide.”
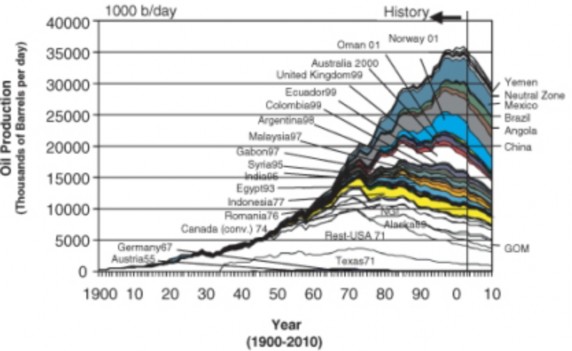
Both developing and developed countries depend almost entirely on petroleum to fuel industrialization and transportation, as well as agriculture. In 1956, geophysicist Mar- ion Hubbert predicted that world oil production would peak about half a century into the future and then decline, initiating a global crisis. Predictions about the conse- quences of Peak Oil range from successful development of alternative fuels, to collapse of the global industrialized economy, to intense nationalism and war. Some analysts, such as energy banker Matthew Simmons, believe that the Peak has already occurred

U.S. and World Population Clocks are maintained by the U.S. Census Bureau online at:
http://www.census.gov/main/www/popclock.html. (9)
(Figure 17.38). Others, like energy industry consultants Wood McKenzie, believe we will not reach the peak for another ten years. The difference does not seem signif- icant, but ten years would allow more time for development of alternative fuels and institution of conservation measures.
Fresh water supplies are declining due to pollution and overuse. According to the United Nations, 2.6 billion people lack water for sanitation, and 1.1 billion have inad- equate supplies of safe drinking water. Irrigation and overuse have seriously reduced groundwater supplies, and water pollution threatens biodiversity as well as human sources. Waterborne diseases and lack of water for sanitation cause up to 80% of human illness. Growing populations, of course, will worsen this water crisis.
Habitat destruction due to agriculture, urban sprawl, and mining is the number one cause of extinction today, precipitating a biodiversity crisis. The World Resources Institute estimates that agriculture has displaced 1/3 of all temperate and tropical forests and ¼ of all grasslands; in the U.S., less than 2% of native prairie ecosystems remain. Stephen Hawking calculates that continuation of the last 200 years’ rate of population growth would have us all standing shoulder-to-shoulder, literally.
Burning fossil fuels has brought about atmospheric change.
Sulfur and nitrogen emissions cause acid rain, which destroys fish, lakes, forests, and lime- stone structures. CO2 emissions lead to global warming. Earth’s surface air temperatures have risen 0.74°C (1.33°F) during the last 100 years, and will continue to rise by 1.1 to 6.4
°C (2.0 to 11.5 °F) by 2100, according to the Intergovernmental Panel on Climate Change (IPCC).
Food, oil, water, land, and air crises support the idea that our human population has al- ready grown beyond carrying capacity with respect to environmental degradation. As world population continues to grow, what can we do to avert famine, disease, or war? How can we prevent a crash? What should be our goal?
Fortunately, individuals, organizations, and governments are beginning to address these problems. The concept of sustainability as a goal for human activities may hold promise for economic, social, and environmental decision-making. Although the term is recent, the concept is clearly expressed in the Great Law of the Iroquois Confederacy:
”In our every deliberation we must consider the impact of our decisions on the next seven generations.” http://en.wikiquote.org/wiki/Native_American_proverbs
A sustainable activity or state can be maintained indefinitely, without compromising re- sources for the future. Sustainability of products and services considers complete life cycles
raw materials, manufacturing, transportation/distribution, use and re-use, maintenance, recycling and ultimate disposal. All phases must address conservation of natural and human resources and also biodiversity. Many people believe current population and lifestyles are not sustainable. Unequal distribution of resources suggests that developing countries may accelerate pressure on resources in order to improve their own lifestyles.
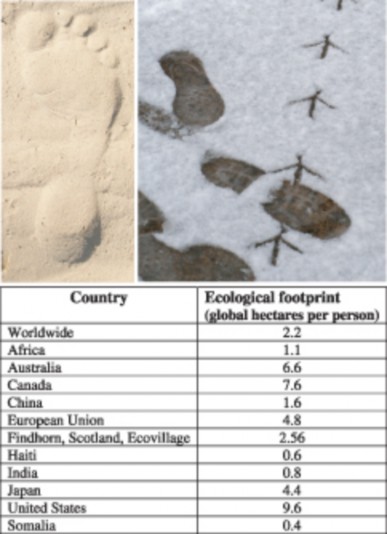
A preliminary tool for estimating sustainability is an ecological footprint analysis. Your ecological footprint is the amount of land area you would need to sustain your current lifestyle. Footprint analysis considers the resources you consume and the pollution you gen- erate, and then calculates the amount of land which would be needed to produce equivalent renewable resources and process associated with waste. Air, land, water, food, and energy resources are all incorporated into the model. You can estimate your own footprint online (see Links at the end of the lesson) and compare it to that of countries throughout the world (Figure 17.39). Note that the average U.S. footprint is 12 times that of India, 24 times that of Somalia, and 4.4 times the world average. The last figure is worth expressing in another way: to provide everyone alive today with our western lifestyle, we’d need 4 or 5 backup planets.
To date, there is no overall agreement on a carrying capacity of Earth for humans, but many people are concerned about population growth, resource depletion and environmental degradation. Joel E. Cohen, in his book How many people can the earth support? summarizes three potential responses to the “population problem” identified at the beginning of the chapter. All three can contribute to the ultimate solution.
The human population, like all populations, has the capacity to reproduce exponentially and yet must live within a finite world. Unique among animals, however, we can utilize technology, cultural planning, and values in decisions which influence our future welfare. Which tools would you choose? What decisions will you help to make?
Lesson Summary
“Make a bigger pie.” Use technology and innovation to create, conserve, and distribute
resources.
“Put fewer forks on the table.” Through birth control and cultural change, reduce both population size and lifestyle expectations.
“Teach better manners.” Transform political and social structures toward the goal of social justice.
According to Neo-Malthusians, the worldwide human population may have already passed Earth’s carrying capacity in terms of environmental degradation, resource de- pletion, and unbalanced distribution of food, wealth, and development. More people will increase the danger of famine or war.
According to the cornucopians, technology and innovation can solve any problems which arise due to human population growth. The more people, the better.
The demographic transition model suggests that human populations pass through four stages of population growth:
Stage 1: Growth is slow and uneven, because high death rate offsets high birth rate.
Stage 2: Development and sanitation reduce death rates, so populations grow exponen- tially.
Stage 3: With industrialization, urbanization and contraception, births fall, and growth begins to decline.
Stage 4: Eventually, birth rate equals death rate, growth rate is zero, and the population stabilizes.
Because this model uses late 18th and 19th century European data, it correlates closely with demographic transitions throughout developed nations into the 20th century, but may not fit undeveloped countries.
No country remains in Stage 1.
A number of poor, undeveloped countries remain in stage 2; age pyramids show large youth populations.
Many countries have entered Stage 3, with some lowering fertility rates by as much as 40%, but pyramid “youth bulges” mean they continue to grow.
Replacement fertility varies from country to country because death rates vary.
A few countries have reduced fertility rates below replacement and are shrinking in population.
Shrinking countries may for a time experience economic difficulties related to an aging population.
In September 2007, world population stood at about 6.7 billion, growing by 211,090 people each day.
The last billion-person increase took only 12 years.
Despite recent declines in birthrate in some developed countries, the human population will continue to increase at least until a peak in 2050 of 9.4 billion people or more.
Many scientists believe that we humans have already overshot the carrying capacity of Earth if resource exploitation and habitat alteration are considered.
Five factors which many believe already limit sustainable human population size are:
Agricultural dependence on nonrenewable fossil fuels for fertilizers, pesticides, and irrigation.
Dependence of industry and transportation on a finite fossil fuel supply, which has already peaked.
Decline in freshwater resources due to pollution and overuse.
Habitat destruction due to urban sprawl and agriculture, and a consequent biodiversity crisis.
Atmospheric changes such as acid rain and global warming – both consequences of increased fossil fuel burning.
The concept of sustainability may hold promise for economic, social, and environmental decisions.
Sustainability of products and services considers complete life cycles from raw materials to disposal.
A tool for estimating sustainability is the ecological footprint.
The average U.S. footprint is 12 times India’s, 24 times Somalia’s, and 4.4 times the world average.
Were all people to adopt a U.S. lifestyle, we would need 4 or 5 planets to supply resources and dispose of waste sustainably.
Potential solutions to the problems of population growth are summarized by Joel E. Cohen:
Review Questions
Further Reading / Supplemental Links
Create new and conserve existing resources – the technological “fix.”
Lower population size and lifestyle expectations – cultural change.
Distribute resources equitably – social justice.
Describe the overall pattern of human population growth, beginning with our origins 200,000 years ago and compare it to the exponential and logistic models.
Compare the factors that influenced human population growth up to the first 1 billion mark to those which controlled growth of the last billion.
Summarize the 5 stages of the demographic transition model in terms of b, d, and r.
Explain the problems with the original, four-stage demographic transition model of human population growth. Give examples of each.
Explain why replacement fertility must exceed 2 children per female.
Use the “pop clock” links at the end of the chapter to look up the current US and world populations. Compare these to predictions for 2050 made by the UN and U.S. Census Bureau. Why do many people consider these numbers to be above Earth’s carrying capacity?
Summarize 5 environmental effects of human activity which may act as limiting factors for population growth. How many of these relate to our use of fossil fuels, and why is this a problem?
Explain how ecological footprints measure sustainability, and compare them for devel- oped and undeveloped nations.
Explain what Joel E. Cohen meant by suggesting that “a bigger pie,” “fewer forks,” and “manners” are needed to address the problems of overpopulation.
Consider what you know about resource limitations, population distribution, levels of consumption, technology, poverty, economics, political realities, religious views, and different human perspectives on the earth. Choose and describe 3 changes you believe would be most successful in solving the problems of worldwide population growth – and 3 changes you believe would be least successful. Support each change with reasons why you think it would be more or less effective.
Joel E. Cohen, How Many People Can the Earth Support? Norton, 532 pp, 1995.
http://www.bradshawfoundation.com/journey
http://desip.igc.org/mapanim.html
http://www.eoearth.org/article/Human_population_explosion
http://www.globalchange.umich.edu/globalchange2/current/lectures/human_pop/ human_pop.html
http://www.census.gov/main/www/popclock.html
http://www.bestfootforward.com/
http://www.footprintnetwork.org/gfn_sub.php?content=footprint_overview
http://www.panda.org/news_facts/publications/living_planet_report/index. cfm
http://www.worldchanging.com/archives/006904.html
http://lca.jrc.ec.europa.eu/lcainfohub/introduction.vm
http://www.ilea.org/leaf/richard2002.html
Vocabulary
carrying capacity The maximum population size that a particular environment can sup- port without habitat degradation.
cornucopian A person who believes that people and markets will find solutions to any problems presented by overpopulation.
demographic transition theory Theory that proposes that human populations pass through 4 or 5 predictable stages of population growth.
density-dependent factor Factor which has the potential to control population size be- cause its effects are proportional to population density.
density-independent factor Factor which may affect population size or density but can- not control it.
ecological footprint The amount of land area needed to sustain a particular lifestyle, matching its resource consumption and pollution to necessary renewable resource pro- duction and waste assimilation.
exponential model (geometric or J-curve) A model of population growth which as- sumes that growth rate increases as population size increases.
k-selected species Species which have adaptations which maximize efficient utilization of resources, conferring competitive strength near or at carrying capacity.
logistic (S-curve) A model of population growth which assumes that the rate of growth is proportional to both population size and availability of resources.
Neo-Malthusians Individuals who believe that human population growth cannot continue without dire consequences.
population A group of organisms of a single species living within a certain area.
elected species Species which have adaptations which maximize growth rate, r.
replacement fertility The number of births per female required to maintain current pop- ulation levels; includes 2 children to replace the parents and a fraction of a child extra to make up for early mortality and sex ratio differences at birth.
Points to Consider
Now that you have studied some of the data on human population growth, return to the questions in the introduction to this lesson and consider whether or not your answers have changed.
Are we built for growth – or for efficient use of resources?
Does our growth pattern resemble a J, or an S? Why?
Do you think Earth has a carrying capacity for humans?
Do you think we are we in danger of extinction?
What exactly is our “population problem,” and what do you think we should do to solve it?
Jared Diamond, reflecting on the fates of past societies facing problems of sustainability, in Collapse: How Societies Choose to Fail or Succeed (2005), p. 522, says: ”Two types of choices seem to me to have been crucial in tipping … outcomes towards success or failure: long-term planning, and willingness to reconsider core values. On reflection, we can also recognize the crucial role of these same two choices for the outcomes of our individual lives.” Do you think the worldwide human population will be able to make these choices wisely?
Image Sources
Randen Pederson. http://www.flickr.com/photos/chefranden/80343473/. CC-BY-SA.
http://www.flickr.com/photos/steelmore/260956919/ http://www.flickr.com/photos/mattfoster/385873034/. CC-BY, CC-BY, CC-BY.
data from USGS. http://commons.wikimedia.org/wiki/Image: Swainson%27s_hawk_migration_route.jpg. Public Domain.
Barbara Akre for Foundation. http://commons.wikimedia.org/wiki/Image:Anatidae-goose_and_chicks.jpg. CC-BY-SA, CC-BY, CC-BY 2.0.
http://www.flickr.com/photos/fpalazzi/1313508508/. (b)CC-BY-SA.
USDA Forest Service. http://commons.wikimedia.org/wiki/Image: Grizzly_Bear_sow_and_cub_in_Shoshone_National_Forest.jpg. Public Domain.
http://commons.wikimedia.org/wiki/File:Pyramide_Japon.PNG. Public Domain, CC-BY-SA.
http://commons.wikimedia.org/wiki/Image:Anatidae-goose_and_chicks.jpg http://commons.wikimedia.org/wiki/File:Mother_and_baby_ducks.JPG.
CC-BY, Public Domain, CC-BY-SA.
A. Belani. http://www.flickr.com/photos/amitbelani/272175413/. CC-BY-SA.
http://commons.wikimedia.org/wiki/Image:Agave_deserti_form.jpg. CC-BY-SA-2.5.
http://commons.wikimedia.org/wiki/Image:Lynx-canadensis.jpg. Public Domain.
http://commons.wikimedia.org/wiki/Image:Ahu_Tahai.jpg.
HB. http://commons.wikimedia.org/wiki/Image:Verhulst-Malthus.png. CC-BY-SA-2.5, 2.0, 1.0.
Piccolo Namek. http://commons.wikimedia.org/wiki/Image: Photos-photos_1088103921_Floating.jpg. GNU-FDL.
http://www.flickr.com/photos/awfulshot/107840108/ http://www.flickr.com/photos/spengler/38793138/. CC-BY, CC-BY, CC-BY.
Original data from the Royal Society of South Australia. . Creative Commons.
by Georgyi Frantsevitch Gause. http://www.ggause.com/gfg05.htm. Public Domain.
http://en.wikipedia.org/wiki/Image:Stage5.jpg. Public Domain.
Hawk Ridge Nature Reserve 2002 Annual Report. BGA and Excel. Public Domain.
US Census Bureau. http://commons.wikimedia.org/wiki/Image: Angola_population_pyramid_2005.png. Public Domain.
from the Government of Quebec. http://commons.wikimedia.org/wiki/Image:Harfang_en_vol_2.jpg. Creative Commons.
Joshua Wickerham. http://www.flickr.com/photos/kafka4prez/34684172/. CC-BY-SA.
http://commons.wikimedia.org/wiki/Image:Brown-Headed_Cowbird.jpg. Public Domain, CC-BY-3.0.
ELT. http://commons.wikimedia.org/wiki/Image:Population_curve.svg. Public Domain.
HB. http://commons.wikimedia.org/wiki/Image:Verhulst-Malthus.png. CC-BY-SA-2.5, 2.0, 1.0.
http://commons.wikimedia.org/wiki/Image:Graywhale_MMC.jpg. Public Domain.
Werner Zittel and Jorg Schlinder.
http://en.wikipedia.org/wiki/Image:Hubbert_world_2004.png. Public Domain.
http://www.flickr.com/photos/pkeleher/987516260/.
http://commons.wikimedia.org/wiki/Image:Pyramide_Etats-Unis.PNG. Public Domain, CC-BY-2.5.
Dawn Endico. http://www.flickr.com/photos/candiedwomanire/9075292. CC-BY-SA.
http://commons.wikimedia.org/wiki/Image:Volterra_lotka_dynamics.PNG. GNU-FDL.
Compiled from multiple authors.
http://en.wikipedia.org/wiki/World_population_estimates. GNU-FDL.
Darkone. http://commons.wikimedia.org/wiki/Image: Kleines_Granatauge_%28Erythromma_viridulum%29_male.jpg. CC-BY-SA-2.5.
http://commons.wikimedia.org/wiki/File: Population_pyramid_1_(triangle).PNG. GNU-FDL.
http://commons.wikimedia.org/wiki/Image:Pinus_banksiana_cone1.jpg.
- Log in or register to post comments
- Email this page