Lesson 13.2: Genetic Change in Populations
Lesson 13.2: Genetic Change in Populations
Lesson Objectives
Compare and relate macroevolution to microevolution.
Define microevolution in terms of allele frequencies.
Define genetic equilibrium for a population.
List the five conditions for genetic equilibrium according to the Hardy-Weinberg model.
State and explain the generalized equation for Hardy-Weinberg equilibrium.
Explain how to use the Hardy-Weinberg equation to solve for allele or genotype fre- quencies.
Discuss the reasons why the 5 conditions for Hardy-Weinberg equilibrium are rarely met.
Explain how mutation disrupts genetic equilibrium.
Predict the possible effects of mutation, and analyze the probability of each type of effect.
Contrast mutation in microorganisms to mutation in multicellular organisms.
Define gene flow.
Describe two possible effects of gene flow on the genetics of a population.
Define genetic drift.
Describe three possible effects of genetic drift on populations and/or specific alleles.
Explain and give an example of the bottleneck effect.
Clarify and give an example of the concept of “founder effect.”
Compare and contrast genetic drift and natural selection as causes of evolution.
Discuss natural selection and evolution in terms of phenotypes and allele frequencies.
Explain the distribution of phenotypes for a trait whose genetic basis is polygenic.
Using a normal distribution of phenotypic variation, interpret directional, disruptive, and stabilizing patterns of selection.
Define fitness as it relates to natural selection.
Describe how natural selection can sometimes lead to the persistence of harmful or even lethal allele.
Analyze the logic of kin selection.
Introduction
How many people in the United States carry the recessive allele for the lethal genetic disease, cystic fibrosis?
Why must we treat AIDS patients with multi-drug “cocktails?”
Why do we consider Northern Elephant seals endangered, even though their population has risen to 100,000 individuals?
Why don’t South African Cheetahs reject skin grafts from unrelated individuals?
What were the probable effects on human evolution of the six years of “volcanic winter” caused by the “megacollosal” eruption of Mt. Toba 70,000 years ago?
Why do humans vary in skin color?
Why doesn’t natural selection eliminate certain lethal genes?
This lesson will introduce you to our current understanding of the causes of evolution and show you how scientists use this understanding to solve problems and answer puzzling ques- tions like those above.
Microevolution
In an earlier chapter, we defined microevolution as evolution within a species or population, and macroevolution as evolution at or above the level of species. The differences between the two are time and scale. Microevolution can refer to changes as small as a shift in allele frequencies for a single gene from one generation to the next. In contrast, macroevolution describes changes in species over geologic time. Many biologists consider evolution to be a single process; they regard macroevolution as the cumulative effects of microevolution. The History of Life chapter discussed patterns and processes of macroevolution; this lesson will focus on genetic changes within populations and species. At this level, we can see how evolution really works – a view that Darwin never had.
A change in allele frequencies within a population from one generation to the next – even if it involves only a single gene - is evolution. Biologists refer to this change in the gene pool as microevolution because it is evolution on the smallest scale. For our rabbit population from the previous lesson, a generation-to-generation increase in the frequency of the albino allele, b, from 0.3 to 0.4 (and the corresponding decrease in the frequency of allele B from
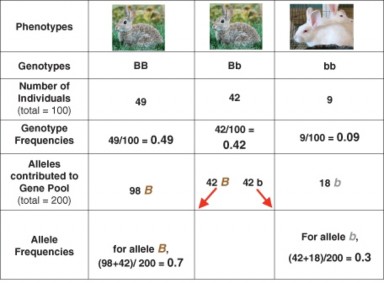
We will consider the above in more detail in later sections of the lesson, because deviations from these conditions are the causes of evolutionary change. For now, let’s look more closely at the Hardy-Weinberg’s equilibrium model. We’ll use another hypothetical rabbit popula- tion to make the model concrete: 9 albino rabbits and 91 brown rabbits (49 homozygous and 42 heterozygous). The gene pool contains 140 B alleles and 60 b alleles – gene frequencies of 0.7 and 0.3, respectively. Figure 13.10 summarizes the data for this parent population.
If we assume that alleles sort independently and segregate randomly as sperm and eggs form, and that mating and fertilization are also random, the probability that an offspring will receive a particular allele from the gene pool is identical to the frequency of that allele in the population. A Punnett Square (Figure 13.11) using these frequencies predicts the probability of each genotype (and phenotype) in the next generation:
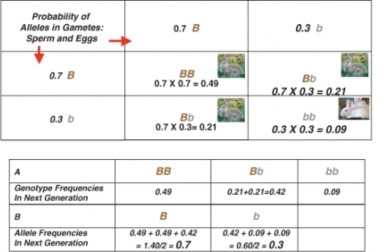
Figure 13.11: A Punnett Square predicts the probability of each genotype and phenotype for the offspring of the population described in Figure 13.10. A summarizes the frequencies of each genotype among offspring, and B calculates allele frequencies for the next generation. Comparing these to the parent generation shows that the gene pool remains constant. The population is stable – at a Hardy-Weinberg equilibrium. (4)
If we calculate the frequency of genotypes among the offspring predicted by the Punnett square, they are identical to the genotype frequencies of the parents. Allele frequency remains constant as well. The population is stable – at a Hardy-Weinberg genetic equilibrium.
A useful equation generalizes the calculations we’ve just completed. Variables include p = the frequency of one allele (we’ll use allele B here) and q = the frequency of the second allele (b, in this example). We will use only two alleles, but similar, valid equations can be written for more alleles.
Recall that the allele frequency equals the probability of any particular gamete receiving that allele. Therefore, when egg and sperm combine, the probability of any genotype (as in the Punnett square above) is the product of the probabilities of the alleles in that genotype. So:
Probability of genotype BB = p X p = p2 and
Probability of genotype Bb= (p X q) + (q X p) = 2 pq and Probability of genotype bb = q X q = q2
We have included all possible genotypes, so the probabilities must add to 1.0. Our equation becomes:
Table 13.2:
p2 + 2 pq + q2 = 1
frequency of geno- type BB
frequency of geno- type Bb
frequency of geno- type bb
This is the Hardy-Weinberg equation, which describes the relationship between allele fre- quencies and genotype frequencies for a population at equilibrium.
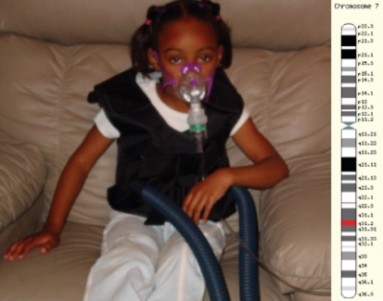
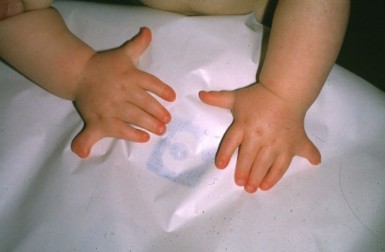
The equation can be used to determine genotype frequencies if allele frequencies are known, or allele frequencies if genotype frequencies are known. Let’s use a common human genetic disease as an example. Cystic fibrosis (CF) is caused by a recessive allele (f ) which makes a non-functional chloride ion channel, leading to excessive mucus in the lungs, inadequate enzyme secretion by the pancreas, and early death (Figure 13.12).
Knowing that 1 of every 3,900 children in the United States is born with CF, we can use the Hardy-Weinberg equation to ask what proportion of the population unknowingly carries the allele for cystic fibrosis. An individual who has CF must have the genotype ff , because the allele is recessive. Using the value for the frequency of the homozygous recessive genotype, we can calculate q, the frequency of the recessive allele,f: 1/3900 = 0.0002564 = frequency of ff genotypes = q2
To find q, the frequency of allele f , we must take the square root of the frequency of ff
genotypes:
q = √0.0002564 = 0.016 = frequency of the f allele
Because p + q = 1 (the sum of the frequency of allele f and the frequency of allele F must equal 1.0),
p = 1 – q = 1.0 – 0.0160 = 0.9840 = frequency of the F allele
According to the Hardy-Weinberg equation, for a population at equilibrium the frequency of carrier genotypes, Ff , is 2pq = 2 X 0.016 X 0.984 = 0.0315.
In other words, if the population is indeed at equilibrium for this gene, just over 3% of the population carries the recessive allele for cystic fibrosis.
Of course, this calculation holds only true if the US population meets the five conditions we listed at the beginning of this section. In nature, populations seldom satisfy all five criteria. Let’s consider how well each condition describes the US population for the cystic fibrosis gene:
Although the equation ideally describes an infinitely large population – never found in nature, of course – the US population is probably large enough that this condition alone does not significantly disrupt equilibrium.
Mutations happen constantly, if at a low rate, so “no mutation” is a second unrealistic condition. However, mutations affecting any one particular gene are rare, so their effect on an otherwise large, stable population is small.
This condition assumes no net additions or losses of either allele to the gene pool through immigration or emigration. For the US population, immigration is probably more significant than emigration. Gene flow, in essence is the flow of alleles into or out of a population, may be the most significant problem for this particular gene, because the frequency of the allele for cystic fibrosis varies greatly according to ancestry. Although 1 in 25 Europeans carry the f allele, the frequency is just 1 in 46 among Hispanics, 1 in 60 among Africans, and 1 in 90 among Asians. Therefore, disproportionate immigration by certain groups changes allele frequencies, destabilizing the Hardy-Weinberg equilibrium.
Here is another assumption which is probably not realistic. Marriage between individuals of similar ancestry and culture is still more common than intermarriage, although both occur.
If marriages are not random, Hardy-Weinberg equilibrium does not apply.
The final condition is that all genotypes must have an equal chance to survive and reproduce. Victims of cystic fibrosis (genotype ff ) have shorter lifespans, which inevitably reduce re- production compared to individuals without the disease (genotypes FF and Ff ). Although medical care is improving, differential survival and reproduction among genotypes means the gene pool is not at equilibrium.
With respect to the cystic fibrosis gene, the U.S. population fails to meet at least three of the criteria for equilibrium. Therefore, the actual frequencies of alleles and genotypes probably deviate somewhat from those we calculated.
In nature, very few populations meet the Hardy-Weinberg requirements for equilibrium. If we look at this fact from a different angle, we see that any of these conditions can destabilize equilibrium, causing a change in allele frequencies. In other words, these five conditions are five major causes of microevolution. The remaining sections of this lesson will explore each cause in detail.
Causes of Microevolution: Mutation and Gene Flow
As discussed in the last lesson, mutation – a random, accidental change in the sequence of nucleotides in DNA – is the original source of genetic variation. Only mutation can create new alleles – new raw material for natural selection. UV or ionizing radiation, chemicals, and viruses constantly generate mutations in a gene pool, destabilizing genetic equilibrium and creating the potential for adaptation to changing environments. However, both rates of mutation and their effects on the fitness of the organism vary.
In multicellular organisms, most mutations occur in body cells and do not affect eggs and sperm; these are lost when the individual dies and usually do not affect evolution. Only mutations in gamete-producing cells can become part of the gene pool. The rate at which mutations enter the gene pool is low, due to DNA “proofreading” and repair enzymes - and the extensive amount of “junk” DNA which does not code for protein. Mutations which do change nucleotide sequences in functional genes may also have no effect, because the Genetic Code is redundant (multiple similar codons for a single amino acid), or very little effect, if the amino acid is not located in a critical part of the protein.
Occasionally, however, a single nucleotide substitution can have a major effect on a protein
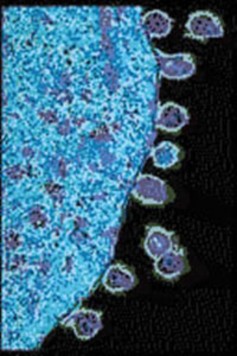
to 0.6) would be microevolution. The changes in Galapagos finch beak size, documented by Peter and Rosemary Grant, and the color changes of peppered moths will undoubtedly show corresponding changes in allele frequencies once we identify the responsible genes and alleles. Resistance to antibiotics in bacteria and the appearance of new strains of influenza viruses and HIV Figure 13.9 also involve changes in allele frequencies. Each of these is an example of microevolution.
What forces cause changes in allele frequencies? What mechanisms determine how mi- croevolution happens? Before we tackle these questions, we will examine a population at equilibrium – a population which is not evolving.
Populations at Equilibrium: The Hardy-Weinberg Model
Like Darwin and Wallace, who independently developed similar ideas about evolution and natural selection, mathematician Godfrey Hardy and physician Wilhelm Weinberg indepen- dently developed a model of populations at equilibrium. The Hardy-Weinberg model
(sometimes called a law) states that a population will remain at genetic equilibrium - with constant allele and genotype frequencies and no evolution - as long as five conditions are met:
No mutation
No migration
Very large population size
Random mating
No natural selection
as we saw with sickle-cell anemia in the last lesson. Usually, the effect of a mutation on a protein is harmful; rarely is it helpful. In sickle-cell anemia, it is both – in certain environments. Sickled cells carry oxygen much less efficiently, but prevent malaria infections. Overall, the chance that a single mutation will increase the fitness of a multicellular organism is extremely low. If the environment changes, however, the adaptive value of a new allele may change as well. Over time, mutations accumulate, providing the variation needed for natural selection.
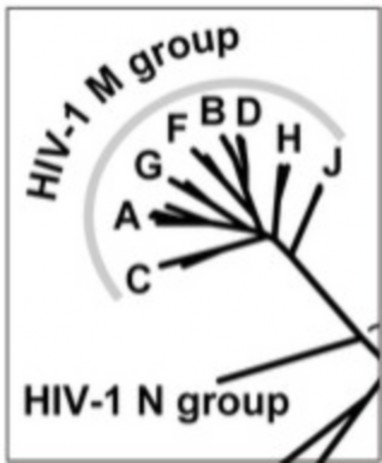
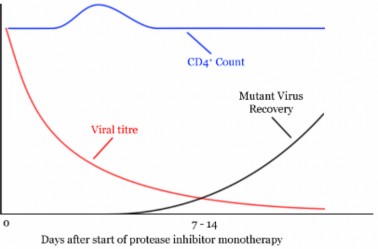
For the small genomes of viruses and bacteria, mutations affect genes directly and generation times are short, so rates of mutation are much higher. For an HIV population in one AIDS patient, rates of viral mutation and replication are so high that in a single day, every site in the HIV genome may have experienced mutation (Figure 13.13). This rapid generation of new alleles challenges our best efforts at drug treatment, and explains the evolution of drug antibiotic resistance. Because of the abundance of random, spontaneous mutations, HIV generates a large amount of raw material for natural selection, and readily evolves resistance to new “environments” created by single drugs (Figure 13.14). Drug “cocktails,” which contain multiple anti-viral chemicals, are our effort to change the “environment” and keep up with mutation in the human-HIV evolutionary race. For microorganisms, mutation is a strong force for evolution.
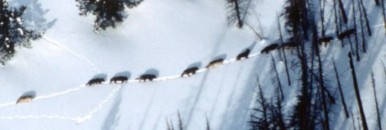
For all organisms, mutations are the ultimate source of genetic variation. For a population, however, the immigration or emigration of individuals or gametes may also add to or subtract from a gene pool – a process known as gene flow. For example, wind or animals can carry pollen or seeds from one plant population to another. In baboon troops or wolf packs (Figure
13.15), juvenile males may leave the group to find mates and establish separate populations. Human history includes countless migrations; gene flow continues to mix gene pools and cause microevolutionary change.
Gene flow can bring into a population new alleles which occurred by chance and were success- ful in other populations. In this way, it can accelerate microevolution. However, if exchange between populations is frequent, it reduces differences between populations, in effect increas- ing population size. In this case, gene flow tends to maintain separate populations as one species, reducing speciation, if not microevolution.
Mutation, together with recombination of existing alleles by sexual reproduction (see lesson 13.1) provides the diversity which is the raw material for natural selection and evolution. Gene flow can accelerate the spread of alleles or reduce the differences between populations. Both can contribute significantly to microevolution. However, many biologists consider the major causes of microevolutionary change to be genetic drift and natural selection.
Causes of Microevolution: Population Size and Genetic Drift
Recall that the third requirement for Hardy-Weinberg equilibrium is a very large population size. This is because chance variations in allele frequencies are minimal in large populations. In small populations, random variations in allele frequencies can significantly influence the “survival” of any allele, regardless of its adaptive value. Random changes in allele frequencies in small populations are known as genetic drift. Many biologists think that genetic drift is a major cause of microevolution.
You see the effects of chance when you flip a coin. If you flipped a penny 4 times, you would not be too surprised if it came up heads 4 times and tails not at all. If you tossed it 100 times, you would be very surprised if the results were 100 heads and no tails. The larger the “population” of coin tosses, the lower the effects of chance, and the closer the results
should match the expected 50-50 ratio. The same is true for populations. If we imagine a rabbit population with a very small gene pool of just 2 B alleles and 2 b alleles, it is not difficult to understand that occasionally, chance alone would result in no albino offspring (only genotypes BB or Bb) – or even no brown offspring (only genotype bb). However, a gene pool of 100 B alleles and 100 b alleles would be very unlikely to produce a generation of offspring entirely lacking one allele or the other, despite having identical initial allele frequencies of 0.5.
Because chance governs meiosis and fertilization, random variations can influence allele fre- quencies, especially for small populations. Note that these chance variations can increase the frequency of alleles which have no adaptive advantages or disadvantages – or decrease the frequency of alleles which do have adaptive value. Genetic drift can result in extinction of an allele or an entire population – or rapid evolution (Figure 13.16). Two sets of circum- stances can create small populations for which genetic drift can have major consequences: the bottleneck effect and the founder effect.
The Bottleneck Effect
Natural catastrophes such as earthquakes, floods, fires, or droughts can drastically reduce population size – usually without respect to allele frequencies. As a result of the disaster, some alleles may be lost entirely, and others may be present in frequencies which differ from those of the original population. The smaller population is then subject to genetic drift, which may further reduce diversity within the population. The loss of diversity resulting from a drastic reduction in population size and subsequent genetic drift is the bottleneck effect (Figure 13.17). Much of our concern for endangered species derives from our understanding of the way in which small population size can reduce diversity by increasing genetic drift. We will look at two examples of the bottleneck effect – one caused by humans, and the other probably experienced by our human ancestors.
During the 19th century, overhunting reduced the worldwide population of Northern Elephant Seals (Figure 13.18) to fewer than 100 individuals. Because an alpha bull typically mates with a “harem” of 30-100 females, it is possible that just a single male fathered all the seals which exist today! After legal protection, their numbers have rebounded to 100,000. However, the effects of the past bottleneck - significant loss of genetic variability – remain. Reduced genetic diversity means that today’s seals are more susceptible to disease and weather. Effects of genetic drift on the gene pool may have contributed to the loss of 80% of pups during the El Nino year of 1997-98.
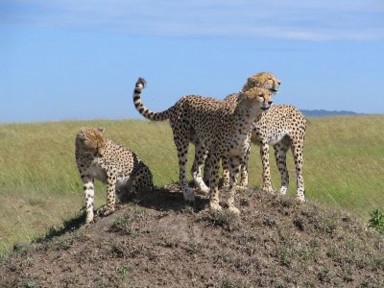
Although the exact cause is unknown, a bottleneck for South African Cheetahs (Figure 13.19) during the last ice age about 10,000 years ago has apparently led to extremely low genetic variability. Genetic variation among cheetahs has been compared to that of highly inbred varieties of laboratory mice; skin grafts between unrelated individuals are not rejected. These animals also suffer from low sperm counts. Like many endangered species, cheetahs
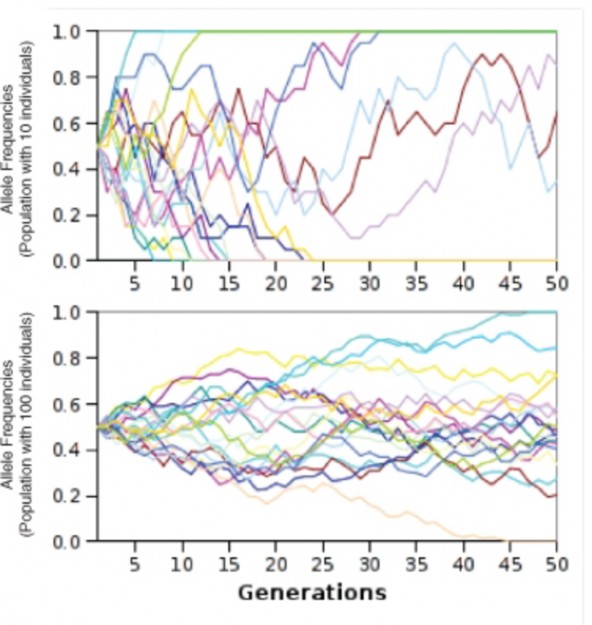
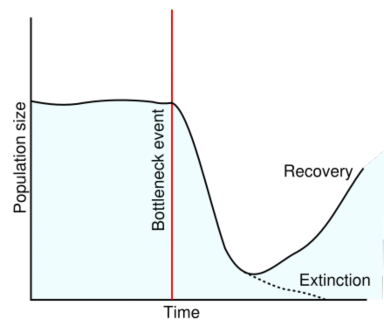
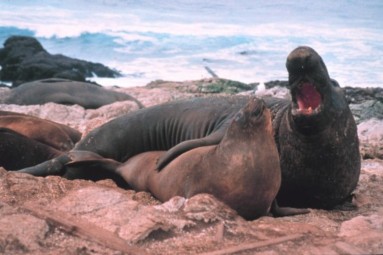
Figure 13.18: The Northern Elephant Seal population fell to fewer than 100 individuals due to overhunting during the 19th century. Although their numbers have recovered, the bottleneck effect of reduced genetic variation limits their potential to adapt to future environmental changes. (16)
are threatened not only by habitat loss, but also by reduced genetic diversity, which reduces their potential to adapt to changing environments.
We humans may have experienced a population bottleneck between 70,000 and 75,000 years ago, when supervolcano Mount Toba exploded with category 8 (“megacolossal!”) force in Sumatra. According to anthropologist Stanley Ambrose’s theory, global temperature dropped as much as 5 degrees Celsius for several years, possibly leading to an ice age. Ambrose believes that the environmental effects (“six years of relentless volcanic winter”) reduced the total human population to less than 10,000, and that isolated individual popu- lations would have experienced genetic drift and rapid evolution or extinction.
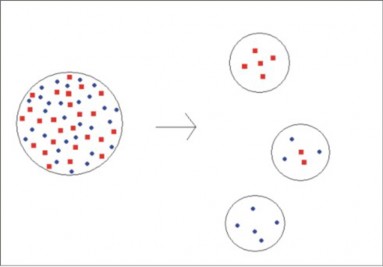
The Founder Effect
Whereas a drastic reduction in population size causes the bottleneck effect, a form of popu- lation expansion leads to the founder effect. If a small group of individuals (the founders) breaks off from a larger population to colonize a distant area, they will probably carry with them only a limited amount of the genetic diversity of the original population (Figure 13.20). For this reason, the new population they establish may differ significantly in genotype and phenotype. Inevitably, it will also be small and therefore subject to genetic drift.
On newly formed islands, such as the Galapagos, Hawaii, and more recently Surtsey, Iceland, founder populations are often the only source of life on the island. Many founder populations
probably become extinct, but others evolve rapidly, due to genetic drift. Some may diverge rapidly to occupy many available ecological niches – a process known as adaptive radia- tion. As we have discussed in past chapters, Galapagos finches and Hawaiian honeycreepers probably each evolved from small populations of a single ancestral finch-like species (see the previous chapter on Evolutionary Theory).
Historically and even today, human populations have experienced founder effects. In some cases, migration and colonization are the cause. Quebec was founded by a group of no more than 2,600 people, ancestors of today’s more than 7 million Quebecois, who show remarkable genetic similarity and a number of heritable diseases, well studied by geneticists.
Cultural isolation, as well as colonization, can result in founder effects. Amish populations in the United States have grown from an initial group of about 200 immigrants, dating back to the mid-1700s. Because they have remained culturally and reproductively isolated from non- Amish Americans, they show considerable uniformity. The Amish today are often studied for their genetic uniformity, as well as certain recessive conditions. Geneticists believe that just one or two of the initial 200 Amish carried a recessive allele for Ellis-van Creveld syndrome (short limbs, extra fingers, and heart anomalies), yet through genetic drift, the isolated Amish population now has the highest incidence of this syndrome in the world (Figure 13.21).
Natural Selection
While genetic drift, including the bottleneck and founder effects, can cause microevolution (generational change in allele frequencies), its effects are mostly random. The results of genetic drift may include enhanced capabilities, but more often, they are neutral or delete- rious. Natural selection depends not on chance, but on differential survival determined by an individual’s traits. Even though the variations are due to chance, the products of natural selection are usually organisms well-suited to their environment.
Recall that Hardy-Weinberg equilibrium requires that all individuals in a population are equal in their ability to survive and successfully reproduce. As Darwin noted, however, overproduction of offspring and variation among individuals often lead to differential survival and reproduction – in other words, natural selection (Figure 13.22). We discussed natural selection as a part of Darwin’s theory of evolution in the last chapter, but in this section, we will go deeper than Darwin could. We will explore natural selection at the level of populations – in terms of allele, genotype, and phenotype frequencies.
Acting on an Organism’s Phenotype
Natural selection acts on an organism’s phenotype (appearance), which is a product of genotype and any environmental influences on gene expression. By selecting for alleles which improve survival and/or reproduction and selecting against harmful alleles, natural selection changes the proportion of alleles from one generation to the next – causing microevolution.
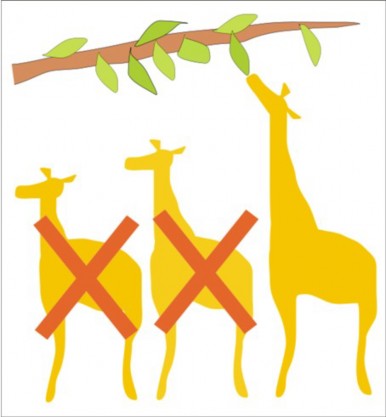
Figure 13.22: Natural selection involves (1) heritable variation (here, giraffe neck length);
Let’s return once more to our rabbit population. If a predator such as a hawk can see white rabbits (genotype bb) more easily than brown rabbits (BB and Bb), brown rabbits are more likely than white rabbits to survive hawk predation. Because more brown rabbits will survive to reproduce, the next generation will probably contain a higher frequency of B alleles. Note, however, that the recessive b alleles are unlikely to disappear completely, because they can “hide” from the hawks in heterozygous brown rabbits. This is a good reminder that natural selection acts on phenotypes, rather than genotypes. The hawk - or natural selection - is unable to distinguish a BB rabbit from a Bb rabbit. Natural selection - and the hawk - is only able to distinguish a brown rabbit from a white rabbit, demonstrating how natural selection acts on the phenotype rather than the genotype of an organism.
Consider a different example, which emphasizes reproduction rather than survival: If both brown and white rabbits preferred to mate with white rabbits, the next generation’s gene pool would probably show an increase in the frequency of the b allele, because white rabbits would be more likely to reproduce successfully.
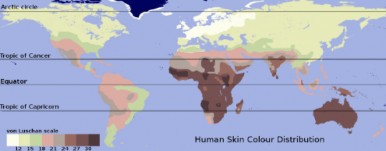
Although some traits are determined by a single gene, many are influenced by more than one gene (polygenic). The result of polygenic inheritance is a continuum of phenotypic values which often show a bell curve pattern of variation. Figure 13.24 shows the effect of three genes, each having two alleles, on human skin color; the result is a normal distribution ranging from very dark to very light, with a peak near the middle. You can demonstrate polygenic inheritance (probably with some environmental influence) for height, ear length, or handspan by measuring your classmates and graphing the data in a similar fashion. Some curves will be flat, and others sharp – but most will resemble the normal “bell” shape.
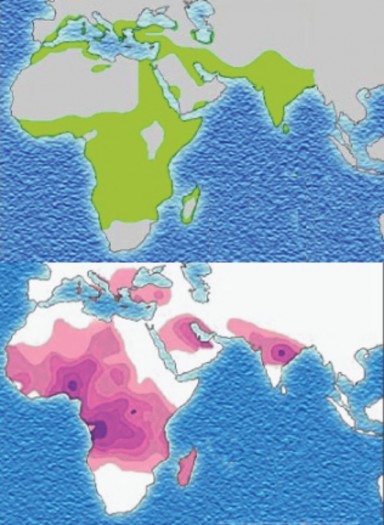
Given this pattern of phenotypic variation, natural selection can take three forms (Figure 13.23). We will use the theoretical human skin color distribution Figure 13.24 to illustrate the three types of selection. Directional selection shifts the frequency curve away from the average by favoring individuals with an extreme form of the variation. The skin of early humans living in sun-rich Africa received high levels of UV radiation, which destroys vitamin B (folate) and leads to severe birth defects such as spina bifida. Selection, then, favored darker-skinned individuals, and the frequency of the darker alleles increased. After several generations, the curve would still be bell-shaped, but it would have shifted to the right, in the direction of the darker alleles. The average individual would have had darker skin as result of this microevolutionary change.
Natural Selection and Human Migration
As humans migrated into the northern hemisphere, excessive UV radiation was no longer a problem, but the relative lack of sunlight led to lower levels of vitamin D3, normally syn- thesized in the skin and necessary for calcium absorption and bone growth. Thus, selection in the north favored lighter-skinned individuals – by itself another example of directional selection. However, if we consider the human population as a whole at that time, disrup-
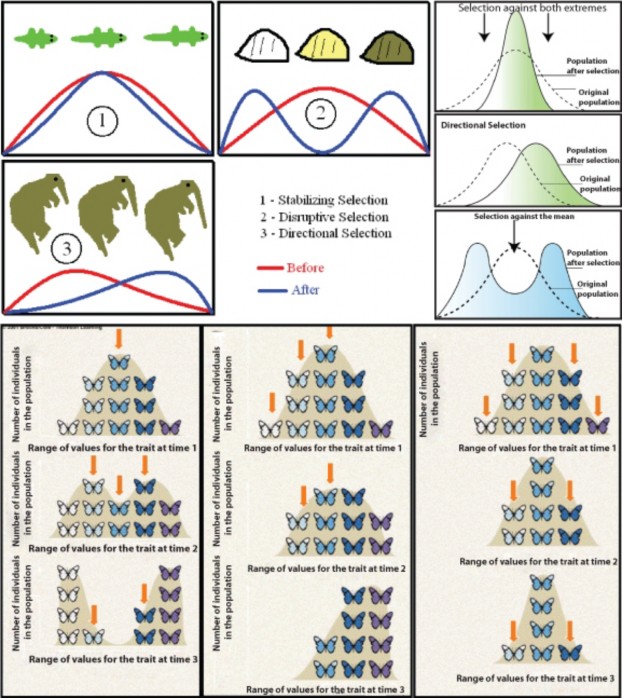
tive selection would describe the microevolution taking place. In northern climates, alleles for light skin would be favored, and in southern climates would select for alleles for dark skin, resulting in two distinct peaks in the distribution of skin color phenotypes and their corresponding genotypes. Keep in mind that the “three gene – dark/light” model is an over- simplification of the genetics underlying skin color, but the adaptive values are real, and the model allows us to illustrate how microevolution works. Note that a map of human skin colors supports this type of selection to some extent (Figure 13.24).
Today, extensive migration, mobility, and intermarriage in the human population may be changing selective pressures on skin color once again. For the sake of argument, let’s make the somewhat unrealistic assumption that mixing becomes complete and that all people will be sufficiently mobile that they experience intermediate levels of sunlight. These conditions would select against both extremely dark skin (too little vitamin D3) and extremely light skin (too little vitamin B-folate). The result would be a taller, narrower distribution – less diversity - about the same mean, a phenomenon known as stabilizing selection. Although our example is perhaps unrealistic, stabilizing selection is probably the most common form of natural selection, preventing form and function from straying away from a “proven” norm.
Stabilizing Selection
Stabilizing selection can lead to the preservation of harmful alleles. A famous example, which we considered in earlier lessons, is sickle-cell anemia. The gene for Beta-hemoglobin - half of the oxygen-carrying protein in our blood - has two alleles, which we will call Hgb-A and Hgb-S. Individuals having two copies of the Hgb-S allele suffer from sickle-cell anemia, a potentially lethal disease in which sickled cells clog capillaries and cannot carry oxygen efficiently. In equatorial regions, individuals with two copies of Hgb-A become infected with Plasmodium parasites and often die from malaria. However, individuals with one copy of each allele (the heterozygous genotype) escape both causes of death; although they may experience slight sickling at high altitudes, they do not suffer from full-blown anemia, and
malaria parasites cannot infect their red blood cells. Stabilizing selection has maintained the frequencies of both alleles, even though each is potentially lethal in the homozygous state.
Selection for a particular trait may also select for other traits which do not directly affect fitness – if, for example, genes are linked, or if a single gene influences several different traits.
Fitness
Another way to look at natural selection is in terms of fitness - the ability of an organism with a certain genotype to reproduce. Fitness can be measured as the proportion of that organism’s genes in all of the next generation’s genes. When differences in individual geno- types affect fitness, the genotypes with higher fitness become more common. This change in genotype frequencies is natural selection.
Kin Selection
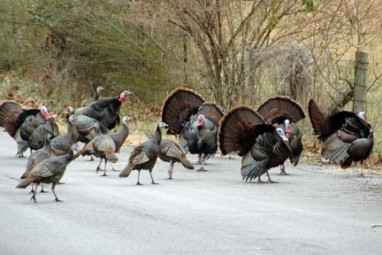
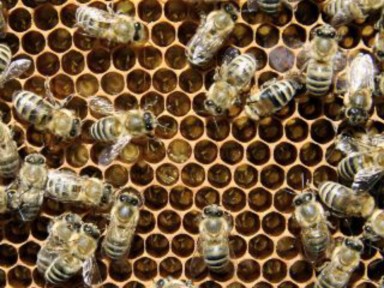
An intriguing corollary of genotype selection is kin selection. Behaviors which sacrifice reproductive success or even survival can actually increase fitness if they promote the survival and reproduction of close relatives who share a significant proportion of the same genes. Examples include subordinate male turkeys, who help their dominant brothers display to potential mates (Figure 13.26) and honeybee workers, who spend their lives collecting pollen and raising young to ensure that their mother, the queen, reproduces successfully (Figure 13.27).
We have looked carefully at equilibrium populations and at possible disruptions of equilib- rium which cause microevolution – a generational change in a population’s allele frequencies:
Mutation, which together with sexual reproduction is the ultimate source of variation,
and is an important cause of microevolution in microorganisms
Gene flow, which can accelerate microevolution by importing new, already successful alleles
Genetic drift, which can increase the effect of chance variations in small populations
Natural selection, which can be directional, disruptive, or stabilizing
Specialized types of selection, such as mate selection and kin selection
Evolutionary biologists are not yet in agreement regarding the relative importance of each type of selection to the history of life, although most would agree that natural selection is the primary force in microevolution. In the next lesson, we will apply our understanding of microevolutionary processes to that “mystery of mysteries,” as Darwin and Herschel called it: the origin of species.
Lesson Summary
Macroevolution – change in species over geologic time – is the cumulative effect of microevolution.
Microevolution – evolution within species or populations – can be measured as a generation-to-generation change in allele frequencies.
Non-evolving populations have constant frequencies of alleles and genotypes – genetic equilibrium.
The Hardy-Weinberg model holds for equilibrium populations under 5 conditions:
no mutation
no migration
very large population size
random mating
no natural selection
A generalized form of the Hardy-Weinberg equation for a gene pool of two alleles at equilibrium is:
Table 13.3:
p2 + 2 pq + q2 = 1
frequency of geno- type BB
frequency of geno- type Bb
frequency of geno- type bb
where p is the frequency of one allele and q the frequency of the other allele.
In nature very few populations meet the Hardy-Weinberg requirements for equilib- rium, due to constant mutation, gene flow, small populations, nonrandom mating, and environmental change.
Random, spontaneous mutations constantly generate new alleles in a gene pool, desta- bilizing genetic equilibrium and creating the potential for adaptation to changing en- vironments.
In multicellular organisms, only mutations that affect germ cells become part of the gene pool.
Because of extensive “junk” DNA, repair enzymes, and multicellularity, many muta- tions do not reach the gene pool.
Many mutations are harmful, disrupting protein function.
Because the genetic code is redundant and some amino-acid substitutions may not change protein function, many mutations have no effect on an organism’s fitness.
Even neutral mutations hold potential for future selection if the environment changes.
A few mutations may be advantageous, improving or changing protein function.
In microorganisms mutation rates are much higher due to rapid reproduction and small genomes.
Mutation, together with recombination of existing alleles provides the diversity which
is the raw material for natural selection and evolution.
The movement of genes from one population to another (gene flow) can change allele frequencies.
Gene flow can accelerate the spread of successful alleles or reduce differences between populations.
In small populations random variations in allele frequencies can significantly influence the “survival” of any allele, regardless of its adaptive value; this phenomenon is genetic drift.
Genetic drift can result in extinction of an allele or an entire population.
Alternatively, genetic drift can lead to rapid evolution of a population.
In the bottleneck effect, a catastrophe or disease or overhunting dramatically reduces a population’s size and genetic variation, increasing its susceptibility to the effects of genetic drift.
In the founder effect, a small group leaves a larger population to colonize a new area. Again, genetic drift may lead to loss of genetic diversity, extinction, or rapid evolution.
Genetic drift leads to evolution in populations of small size, but results are mostly due to chance.
Natural selection occurs in populations of any size, and results are more likely to adapt a population to its environment.
Natural selection acts on phenotype variations, so may include environmental effects which are not heritable.
Evolution is a result of natural selection, and is measured as a change in allele frequen- cies.
For a trait whose genetic basis is polygenic, the pattern of phenotypic variation usually forms a bell curve about an average value.
Directional selection results in a shift of allele frequencies toward one extreme.
Disruptive selection favors both extremes over the average phenotypic value.
Stabilizing selection maintains or narrows existing variation in phenotype.
Fitness is the ability of an organism with a certain genotype to reproduce successfully.
Because alleles often affect more than one trait in different ways, or have different effects in different environments, natural selection can sometimes lead to the persistence of harmful or even lethal allele.
Kin selection involves the sacrifice by an individual of his/her reproductive potential in order to help a close relative reproduce successfully.
Review Questions
Further Reading / Supplemental Links
Define microevolution in terms of allele frequencies.
Describe genetic equilibrium, including the Hardy-Weinberg conditions.
In the United States, about 1 in every 12 blacks of African descent carry one copy of the allele for sickle-cell anemia. Assuming the five conditions of Hardy-Weinberg equilibrium hold (we’ll consider why they probably don’t in question #4), calculate the probability that a member of the next generation will suffer from sickle-cell anemia (have the homozygous Hemoglobin S genotype).
Discuss the reasons why the 5 conditions for Hardy-Weinberg equilibrium are probably not met by the black population for the Hemoglobin alleles.
Analyze the possible effects of mutation, and the probability and importance of each.
Describe two possible effects of gene flow on the genetics of a population.
Describe three possible effects of genetic drift on populations and/or specific alleles.
Why do we consider Northern Elephant seals endangered, even though their population has risen to 100,000 individuals?
Use the distribution of phenotypes for a trait whose genetic basis is polygenic to inter- pret directional, disruptive, and stabilizing patterns of selection.
Describe how natural selection can sometimes lead to the persistence of harmful or even lethal allele. Include an example.
“The Gene School:”
http://library.thinkquest.org/19037/population.html
http://genetics-education-partnership.mbt.washington.edu/class/activities/ HS/sickle-bean.htm
http://www.koshland-science-museum.org/teachers/idactivity-act018.jsp
http://chroma.gs.washington.edu/outreach/genetics/sickle/index.html
http://www.umsl.edu/~biology/hwec/MO-STEP/lessons/naturalsel.html
http://www.radford.edu/~rsheehy/Gen_flash/popgen/
http://www.phschool.com/science/biology_place/labbench/lab8/intro.html
http://sps.k12.ar.us/massengale/lab_8_sample2_ap_population_gene.htm
https://www3.nationalgeographic.com/genographic/
http://darwin.eeb.uconn.edu/simulations/simulations.html
http://www.berkeley.edu/news/media/releases/2005/03/02_turkeys.shtml
http://essp.csumb.edu/eseal/kristi_west/history.html
Vocabulary
adaptive radiation Relatively rapid evolution of several species from a single founder population to several to fill a diversity of available ecological niches.
allele frequency The fraction (usually expressed as a decimal) of a population’s gene pool made up of a particular allele.
bottleneck effect The loss of diversity resulting from a drastic reduction in population size and subsequent genetic drift.
directional selection Selection which favors one side of a phenotypic distribution – one allele or one extreme of a normal distribution.
disruptive selection Selection which favors the two extremes of a phenotypic distribution
– the ends of a bell curve, or the homozygous phenotypes, as opposed to the average, or heterozygous phenotype.
fitness The ability of an organism with a certain genotype to survive and reproduce, often measured as the proportion of that organism’s genes in all of the next generation’s genes.
founder effect The loss of genetic diversity resulting from colonization of a new area by a small group of individuals which have broken off from a larger population.
gene flow The net movement of genes into or out of a population through immigration or emigration.
genetic drift Random changes in allele frequencies in small populations.
genetic equilibrium State of a population in which allele and genotype frequencies remain constant from one generation to the next – a non-evolving population.
Hardy-Weinberg model Describes a population at genetic equilibrium, meeting five con- ditions: no mutation, no migration, very large population size, random mating, and no natural selection.
kin selection Behaviors which sacrifice reproductive success or even survival to promote the survival and reproduction of close relatives who share a significant proportion of the same genes.
macroevolution Evolution at or above the species level.
microevolution Evolution within a species or population, also defined as a generation-to- generation change in allele frequencies for a population.
mutation A change in the nucleotide sequence of DNA or RNA.
natural selection The process by which a certain trait becomes more common within a population, including heritable variation, overproduction of offspring, and differential survival and reproduction.
polygenic trait Traits that are influenced by more than one gene.
stabilizing selection Selection which favors the average or heterozygous phenotype, re- sulting in no change or in a narrowing of the distribution of phenotypes.
Points to Consider
This lesson discussed probable past microevolution of alleles for genes for human skin color and hemoglobin. For what other genes (or heritable traits) can you suggest past selective pressures? Do you think certain human genes (or heritable traits) may be at genetic equilibrium? Give some examples, and explain your reasoning.
Some people suggest that we humans have removed ourselves from natural selection. Do you agree?
What are some consequences of understanding that chance variations and natural selection can result in the persistence of lethal alleles, such as the alleles for sickle-cell anemia and cystic fibrosis?
Do you think it is important that people understand the biological basis of skin color? Explain
- Log in or register to post comments
- Email this page