Lesson 18.4: Climate Change
Lesson 18.4: Climate Change
Lesson Objectives
Explain the mechanism of the greenhouse effect.
Recognize that the greenhouse effect maintains an equilibrium.
Compare greenhouse conditions on Earth to those on Mars and Venus.
Explain the extent of current increases in the Earth’s temperature.
Review past changes in the Earth’s temperatures.
Summarize the evidence and support for greenhouse gases as the cause of recent global warming.
Discuss the significance of global warming for Earth’s ecosystems.
Relate global warming to current global stability.
List the atmospheric gases that absorb the Earth’s thermal radiation, and their sources.
Evaluate possible solutions to the problem of global climate change.
Recognize the tradeoffs required by nuclear power plants: reduced emissions vs. ra- dioactive fuels and waste
Introduction
On December 10, 2007, the Intergovernmental Panel on Climate Change (IPCC) and former US Vice President Al Gore received the Nobel Peace Prize “for their efforts to build up and disseminate greater knowledge about man-made climate change, and to lay the foundations for the measures that are needed to counteract such change.” The Peace Prize is designated “to the person who shall have done the most or the best work for fraternity between the nations, for the abolition or reduction of standing armies and for the holding and promotion of peace congresses.” A high honor, the award also announced to the world that climate change (Figure 18.49) is a critical issues for the future of the Earth and its people. What is climate change? What are its causes? How do its effects relate to world peace? What are “the foundations for the measures that are needed to counteract such change”? Can individuals like us help? These are the questions we will explore in this last lesson about human ecology.
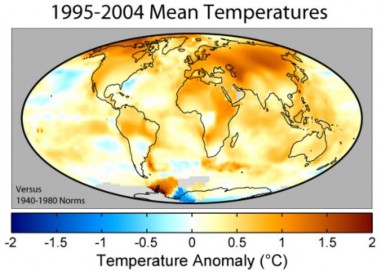
Figure 18.49: Temperature variations from 1940-1980 averages show that most of the Earth warmed significantly in just a single decade. The average temperature change across the en- tire globe for this period is 0.42oC (0.76 oF). Over the past 100 years, surface air temperatures have risen 0.74 ± 0.18 °C (1.33 ± 0.32 °F). (29)
What is the Greenhouse Effect?
The Greenhouse Effect is a natural feature of Earth’s atmosphere – yet another ecosystem service. Without the Greenhouse Effect, Earth’s surface temperature would average -18oC (0oF) – a temperature far too cold to support life as we know it. With the Greenhouse Effect, Earth’s surface temperature averages 15oC (59oF), and it is this temperature range to which today’s diversity of life has adapted.
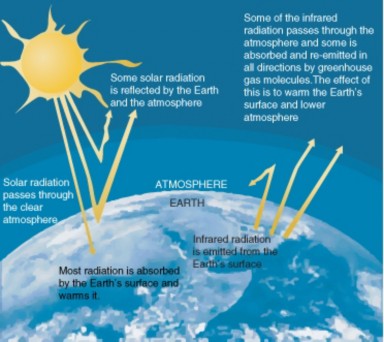
How does this ecosystem service work? The Greenhouse Effect is summarized in Figure
18.50. Of the solar radiation which reaches the Earth’s surface, as much as 30% is reflected back into space. About 70% is absorbed as heat, warming the land, waters, and atmosphere (you may recall that only about 1% is converted to chemical energy by photosynthesis). If there were no atmosphere, most of the heat would radiate back out into space as infrared
radiation. Earth’s atmosphere, however, contains molecules of water (H2O), carbon dioxide (CO2), methane (CH4), and ozone (O3), which absorb some of the infrared radiation. Some of this absorbed radiation further warms the atmosphere, and some is emitted, radiating
back down to the Earth’s surface or out into space. A balance between the heat which is absorbed and the heat which is radiated out into space results in an equilibrium which maintains a constant average temperature for the Earth and its life.
If we compare Earth’s atmosphere to the atmospheres which surround Mars and Venus
(Figure 18.51), we can better understand the precision and value of Earth’s thermal equi- librium. Mars’ atmosphere is very thin, exerting less than 1% of the surface pressure of our own. As you might expect, the thin atmosphere cannot hold heat from the sun, and the average surface temperature is -55oC (-67oF) – even though that atmosphere is 95% CO2 and contains a great deal of dust. Daily variations in temperature are extreme, because the atmosphere cannot hold heat.
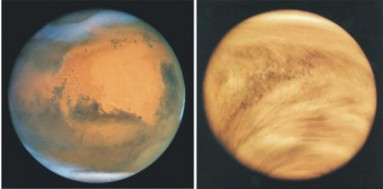
Figure 18.51: The thickness of a planet’s atmosphere strongly influences its temperature through the Greenhouse Effect. Mars (left) has an extremely thin atmosphere, and an average temperature near -55oC. Venus (right) has a far more dense atmosphere than Earth, and surface temperatures reach 500oC. (4)
In contrast, Venus’ atmosphere is much thicker than Earth’s, exerting 92 times the surface pressure of our own. Moreover, 96% of the atmosphere is CO2, so a strong Greenhouse Effect heats the surface temperature of Venus as high as 500oC, hottest of any planet in our solar system. The thick atmosphere prevents heat from escaping at night, so daily variations are minimal. Venus’ atmosphere has many layers which vary in composition, and scientists have identified a layer about 50 km from the surface which could harbor liquid water and perhaps even life; some scientists propose that this would be a reasonable location for a space station. Near this altitude, pressure is similar to the Earth’s sea level pressure, and temperatures range from 20oC to 37oC. Nitrogen, though only 3.5% of Venus’ atmosphere, is present in the same overall amounts as on Earth (because the density on Venus is so much greater); oxygen, however, is absent, and sulfuric acid would present challenges.
Considering the extremes of Greenhouse Effects on Mars and Venus, we can better appreciate the precise balance which allows our own atmosphere to provide temperatures hospitable to liquid water and life. Inevitably, we must also ask this chapter’s repeating query: how have human activities affected this equilibrium? This leads us back to the 2007 Nobel Peace Prize, and an evolving consensus that our species is responsible for significant global warming.
Global Warming
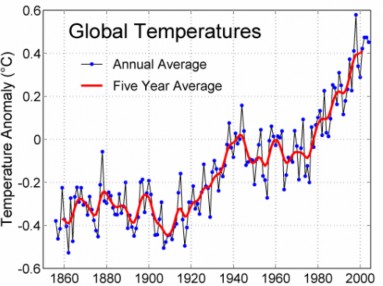
Global warming refers to the recent increase in the Earth’s average near-surface and ocean temperatures (Figure 18.52). During the past 100 years, surface air temperatures have risen ± 0.18 °C (1.33 ± 0.32 °F). Multiple sources agree that the two warmest years since the introduction of reliable instrumentation in the 1800s were 1998 and 2005.
This recent increase contrasts with relatively stable temperatures shown by scientific data for the previous two millennia. Multiple sets of temperature data inferred from tree rings, coral growth, and ice core samples are compiled in Figure 18.53. Warmly debated exceptions to the stability include a warm period during the Middle Ages and a “Little Ice Age,” attributed to decreased solar activity and increased volcanism.
According to paleoclimatologists, on a scale of millions of years Earth’s temperatures have varied almost regularly (over time intervals of roughly 140 million years) from those which support global tropics to continental glaciations (Figure 18.54). Scientists estimate the global average temperature difference between an entirely glaciated Earth and an ice-free Earth to be 10oC.
The causes of Ice Ages are not completely understood, but greenhouse gases, especially CO2 levels, often correlate with temperature changes (Figure 18.55). Rapid buildup of green- house gases in the Jurassic Period 180 million years ago correlates with a rise in temperature of 5oC (9oF). Similar changes have been hypothesized as causes for the dramatic Permian Extinction 250 million years ago and the Paleocene-Eocene Thermal Maximum (one of the
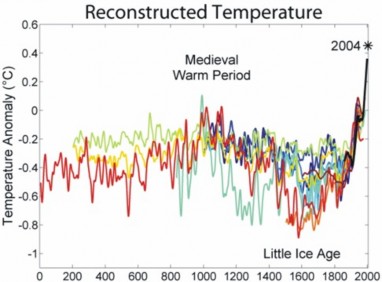
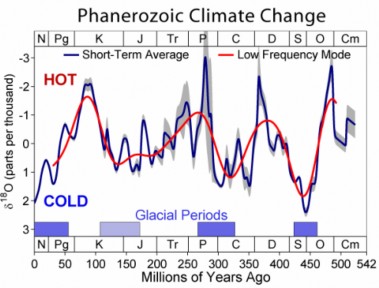
Figure 18.54: Paleoclimatological measures of global temperatures show dramatic fluctua- tions in temperature. Graphs should be read from right (past) to left (present). Ice core data for temperature is recorded in oxygen isotope units rather than oC. (22)
most rapid and extreme global warming events recorded in geologic history) 55 million years ago. Paleoclimatologist William Ruddiman proposes that human activities began to affect global CO2 levels as long ago as 8,000 years, when agriculture and deforestation began. Ruddiman argues that without this early contribution to greenhouse gases, cycles indicate the Earth would already have entered another Ice Age.
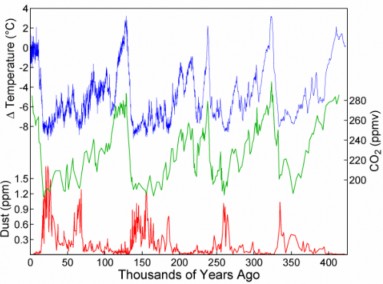
Figure 18.55: Over the past 450,000 years, temperature changes (blue) correlate closely with changes in atmospheric CO2 (green) and dust levels (red). (51)
Others dispute Ruddiman’s “overdue-glaciation” theory, but most scientists today agree that recent global warming since 1850 is caused by an unprecedented rise in atmospheric CO2 (Figure 18.56) which resulted from human activities – primarily burning of fossil fuels, but also continuing deforestation and changes in land use. Fossil fuels burn organic compounds in the same way your cells burn glucose to make ATP: a product of both reactions is CO2. Deforestation and other land use changes contributes to the CO2 levels from the opposite direction – a decrease in photosynthesis, which would have removed CO2 from the atmosphere. Slash-and-burn destruction of tropical forests combines the worst of both worlds; burning adds CO2 to the atmosphere, and the loss of layers of vegetation decreases CO2 use.
Two additional greenhouse gases having anthropogenic (human activity) sources are methane (CH4) and nitrous oxide (NO). Agriculture adds both of these to the atmosphere; cattle production is responsible for much of the methane, a powerful greenhouse gas. Land use changes, waste processing, and fossil fuel production, which we’ve already implicated in CO2 increases, are other anthropogenic (human-caused) sources. A last but important contributing factor is secondary to these primary causes; triggers of “runaway greenhouse effects” will be discussed below.
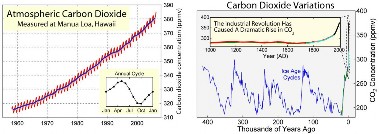
Figure 18.56: Since the Industrial Revolution began, the burning of fossil fuels has dramat- ically increased atmospheric concentrations of CO2 to levels unprecedented in the last 400 thousand years. The graph on the right integrates recent measurements with paleoclimato- logic data. (41)
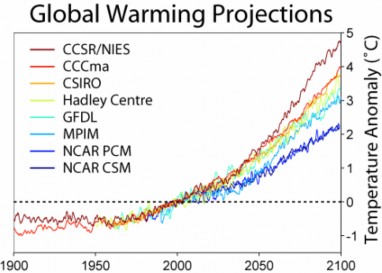
Although the causal connections between fossil fuel combustion, deforestation, greenhouse gases, the greenhouse effect, and global warming have been strongly debated in the past, the majority of the world’s scientific organizations now support these relationships, and many use the term “consensus.” (See “Scientific Opinion about Climate Change” in Further Reading.) The awarding of the Nobel Peace Prize to the organization which focuses most directly on climate change, the IPCC, highlights this consensus. Alternative hypotheses include variation in solar activity; several references are included in Further Reading. The IPCC projects future temperature increases ranging from 1.1 °C to 6.4 °C (2.0 °F to 11.5
°F) between 1990 and 2100. Predictions from multiple models which incorporate connections between greenhouse emissions and global warming are summarized in Figure 18.57; all show significant rises in temperature by 2100.
Once again, then, we “have met the enemy” and “he is us.” What have we done? What are the environmental and socioeconomic consequences of this human disruption in atmospheric equilibrium?
A partial list of effects of climate change includes:
Direct Physical Effects
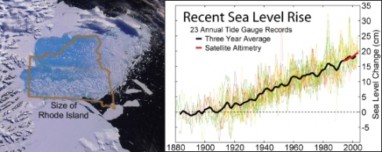
Melting of glaciers and a consequent rise in sea level, already documented (Figure 18.58)
Sea level rise of 18-59 cm predicted by 2100
River flooding followed by drought
Coastal flooding and shoreline erosion
Melting permafrost, leading to release of bog methane (CH4) increasing warming via positive feedback*
Changing patterns of precipitation
Regional drought
Regional flooding
Ocean warming, leading to increased evaporation
Increasing rainfall
Increasing erosion, deforestation, and desertification
Release of sedimentary deposits of methane (CH4) hydrates – positive feedback*
Ocean acidification: 0.1 pH unit drop already documented; 0.5 more predicted by 2100
Loss of corals
Loss of plankton and fish
Temperature extremes
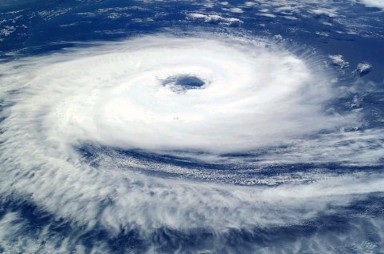
Increasing severity of storms such as tropical cyclones, already documented (Figure 18.59)
Further reductions in the Ozone Layer (due to cooling of the stratosphere)
Ecosystem Effects
Contributions to the Sixth Extinction reaching as much as 35% of existing plant and animal species
Decline in cold-adapted species such as polar bears and trout
Increase in forest pests and fires
Change in seasonal species, already documented
Potential increase in photosynthesis, and consequent changes in plant species
Loss of carbon to the atmosphere due to
Increasing fires, which together with deforestation lead to positive feedback
Increasing decomposition of organic matter in soils and litter
Socioeconomic Threats Result From Some of the Above Changes
These include:
Crop losses due to climate and pest changes and desertification
Increasing ranges for disease vectors (e.g., mosquitoes – malaria and dengue fever)
Losses of buildings and development in coastal areas due to flooding
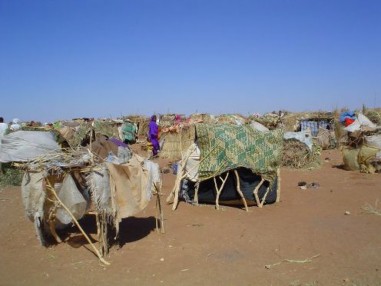
Interactions between drought, desertification, and overpopulation leading to increasing conflicts (Figure 18.60)
Costs to the insurance industry as weather-related disasters increase
Increased costs of maintaining transportation infrastructure
Interference with economic development in poorer nations
Water scarcity, including pollution of groundwater
Threats to Political Stability
Migrations due to poverty, starvation, and coastal flooding
Competition for resources
Note that at least three(*) of the direct physical effects – melting permafrost, ocean warming, and forest fires/deforestation - can potentially accelerate global warming, because tempera- ture increases result in release of more greenhouse gases, which increase temperatures, which result in more greenhouse gases – a positive feedback system aptly termed a “runaway greenhouse effect.” Here’s how it could work: rising temperatures are warming the oceans and thawing permafrost. Both oceans and permafrost currently trap huge quantities of methane – beneath sediments and surface – which would undergo massive releases if tem- peratures reach a critical point. Recall that methane is one of the most powerful greenhouse gases, so the next step would be further increase in temperatures. Warmer oceans and more thawed permafrost would release more quantities of methane – and so on. These compound- ing effects are perhaps the most convincing arguments to take action to reduce greenhouse gas emission and global warming.
What measures have been considered?
Preventing Climate Change
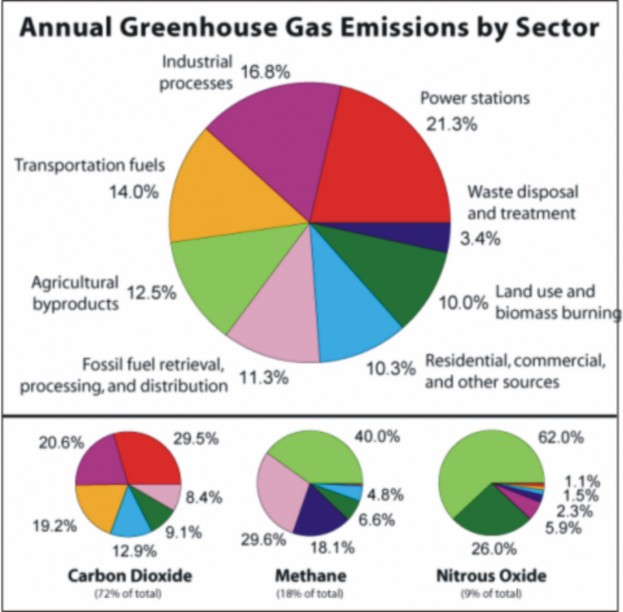
Basically, greenhouse gases are products of fossil fuel combustion; according to the EPA, more than 90% of U.S. greenhouse gas emissions come from burning oil, coal, and natural gas. Therefore, energy use is the primary target for attempts to reduce future global warming. In Figure 18.61 you can see the sources of emission for three major greenhouse gases in 2000, when CO2 was 72% of the total, CH4 18%, and NO 9%. Chlorofluorocarbons (CFCs, HCFCs, and HFCs) are also greenhouse gases; refer to the lesson on The Atmosphere for more information about them.
Knowing the causes of climate change allows us to develop potential solutions. Direct causes include combustion of fossil fuels, deforestation and other land use changes, cattle production, agriculture, and use of chlorofluorocarbons. Runaway effects can result from temperature- dependent release of methane from permafrost and ocean sediments, and forest fires or intentional burning. Unfortunately, the best way to avoid runaway effects is to prevent temperature increases. Prevention, then, should address as many of these causes as possible. A partial list of solutions being considered and adopted follows.
Reduce energy use.
Switch to cleaner “alternative” energy sources, such as hydrogen, solar, wind, geother- mal, waste methane, and/or biomass.
Increase fuel efficiencies of vehicles, buildings, power plants, and more.
Increase carbon (CO2) sinks, which absorb CO2 - e.g., by planting forests.
Cap emissions release, through national and/or international legislation, alone or in combination with carbon offset options (see below).
Sell or trade carbon offsets or carbon credits. Credits or offsets exchange reduc- tions in CO2 or greenhouse emissions (tree-planting, investment in alternative energy sources, methane capture technologies) for rights to increase CO2 (personally, as for air travel, or industry-wide).
Key urban planning to energy use, e.g., efficient public transportation.
Develop planetary engineering: radical changes in technology (such as building solar shades of dust, sulfates, or microballoons in the stratosphere), culture (population con- trol), or the biosphere (e.g. iron-seeding of the oceans to produce more phytoplankton to absorb more CO2).
Legislate Action: International agreements such as the 2005 Kyoto Protocol (which the US has not yet ratified), or national carbon taxes or caps on emissions. Interestingly, in the U.S., some States and groups of States are taking the lead here.
Set goals of carbon neutrality: in 2007, the Vatican announced plans to become the first carbon-neutral state.
Support developing nations in their efforts to industrialize and increase standards of living without adding to greenhouse gas production.
Every potential solution has costs and benefits which must be carefully considered. Human health, cultural diversity, socioeconomics, and political impacts must be considered and kept in balance. For example, nuclear power involves fewer greenhouse gas emissions, but adds the new problems of longterm radioactive waste transport and storage, danger of radiation exposure to humans and the environment, centralization of power production, and limited supplies of “clean” uranium fuels. Studies of costs and benefits can result in solutions which make effective tradeoffs and therefore progress toward the goal of lowering greenhouse gases and minimizing future global warming.
We have reached the point where we understand how and the extent to which our activities have destabilized the Earth’s atmosphere and reduced and threatened its ecosystem services. Now we need to move one step further, and put our knowledge to work in the form of action.
What will you do to help?
Lesson Summary
The awarding of the 2007 Nobel Peace Prize to the Intergovernmental Panel on Climate Change (IPCC) and former US Vice President Al Gore recognizes the potential impact of global warming on the economic, social, and political welfare of the world.
The greenhouse effect is an ecosystem service which warms the Earth to temperatures which support life.
The greenhouse effect involves water, carbon dioxide, methane, and ozone, which ab- sorb heat that would otherwise be radiated out into space.
Earth’s atmosphere maintains an equilibrium between heat added by sunlight and heat lost by radiation.
The atmosphere of Mars is too thin to hold heat, and that of Venus is so thick that temperatures reach 500oC.
In 2000, the major greenhouse gases were CO2, CH4, and NO; CFCs and H2O con- tribute, as well.
Global warming refers to an increase in the Earth’s temperature of 0.74°C (1.33°F) within the past 100 years.
Paleoclimatologists document changes in the Earth’s temperature over millions of years which cycle between tropical and ice age extremes – a variation of 10oC.
Greenhouse gases, especially CO2 levels, often correlate with temperature changes.
Deforestation and agriculture – by reducing levels of CO2 uptake – may have initiated warming 8,000 years ago.
Most scientists today agree that fossil fuel combustion, deforestation, and agriculture contribute to greenhouse gases and the greenhouse effect.
Global warming can cause physical changes for the Earth: melting of glaciers and permafrost, changes in precipitation patterns, temperature extremes, warming and acidification of the oceans, and ozone depletion.
Melting of oceans and permafrost can release methane, resulting in a “runaway green- house effect.”
Ecological effects may include loss of biodiversity and addition of still more CO2 to the
atmosphere.
Socioeconomic threats include crop losses, increased disease, water scarcity, and coastal flooding.
Population growth and socioeconomic factors (especially interference with third world development) can combine to produce political instability and conflict.
Most greenhouse gases are products of fossil fuel combustion, so reduced use, increased efficiency, and alternative fuel development are primary means of prevention of climate change.
CO2 uptake can be increased by eliminating deforestation, reforestation, and green
roofs technology.
Legislation from local to international levels can cap emissions and develop carbon offset trading.
Careful urban planning can increase the efficiency of transportation and energy use.
Planetary engineering could enact radical changes in technology, culture, or the bio- sphere.
Support of third world efforts to develop without adding greenhouse gases could im- prove global stability.
Every potential solution has costs and benefits which must be carefully considered; tradeoffs are necessary.
Review Questions
Further Reading / Supplemental Links
Explain the mechanism of the greenhouse effect.
Compare the effects of the greenhouse effect on Mars and Venus to that on Earth.
Define and quantify global warming.
Describe paleoclimatic changes over the course of Earth’s history. How are these data collected, when no one was around to measure temperatures?
Summarize the evidence for greenhouse gases as the cause of recent global warming.
Discuss the significance of global warming for Earth’s ecosystems.
Relate global warming to current global stability.
Connect the atmospheric gases that absorb the Earth’s thermal radiation to their sources.
Combustion of fossil fuels is a common denominator for many problems related to Atmospheric and Water Resources. Clarify the connections for as many problems as you are able.
Distinguish between and describe the importance to global warming prevention of carbon sequestration, carbon sinks, carbon offsets, emission caps, emissions trading, and carbon neutrality.
Robert Lee Hotz, Huge Dust Plume from China Cause Changes in Climate. Wall Street Journal Online, 20 July, 2007;
http://online.wsj.com/public/article/SB118470650996069354-buQPf_FL_nKirvopk_
_GzCmNOq8_20070818.html?mod=tff_main_tff_top.
NASA, The Greenhouse Effect. NASA Facts Online, NASA Goddard Space Flight Center, NF-182 June 1993;
http://www.gsfc.nasa.gov/gsfc/service/gallery/fact_sheets/earthsci/green. htm.
http://www.ifm-geomar.de/fileadmin/personal/fb1/p-oz/mfrank/Bard_and_Frank_ 2006.pdf
http://www.dsri.dk/~hsv/prlresup2.pdf
http://ipcc-wg1.ucar.edu/wg1/Report/AR4WG1_Print_Ch02.pdf;
http://www.panda.org/about_wwf/what_we_do/climate_change/index.cfm
http://www.epa.gov/climatechange/index.html
Vocabulary
anthropogenic sources Sources of pollution related to human activities.
carbon (CO2) sink A reservoir which increases absorption of CO2 – e.g. a forest planta- tion.
carbon offsetting Mitigating or reducing greenhouse gas emissions, often as a trade-off from one location to another.
carbon sequestration Process which removes CO2 from the atmosphere.
carbon-neutral Describes an individual, activity, industry, or a political unit which bal- ances CO2 release with activities which sequester carbon.
emissions cap Upper limit on CO2 (or other pollutant) release; may be tradable or sell- able.
emissions trading Reducing greenhouse emissions by purchasing or exchanging means of reducing CO2 in exchange for rights to release CO2 .
global warming The recent increase in the Earth’s average near-surface and ocean tem- peratures.
greenhouse effect The trapping by the atmosphere of heat energy radiated from the Earth’s surface.
greenhouse gas Atmospheric substance which transmits solar radiation but absorbs in- frared radiation: CO2, CH4 and NO, for example.
planetary engineering Radical, often global changes in technology, culture, or the bio- sphere management.
runaway greenhouse effect A positive feedback loop in which increasing temperature triggers the release of more greenhouse gases, which further increase temperature, which releases more gases.
Points to Consider
Do you think global warming is a good example of an “ecosystem service” – or perhaps a “ biosphere service?” Explain your reasoning.
How is the Greenhouse Effect both positive and negative?
Which of the suggestions for preventing climate change do you think are most realistic for you?
How might you, as an individual, contribute to national and international solutions to climate change?
How might we do a better job of building the costs of global warming into the economics of fossil fuel use, deforestation, agriculture, and cattle production?
Image Sources
Elin Whitney Smith. http://en.wikipedia.org/wiki/File: Extinctions_Africa_Austrailia_NAmerica_Madagascar.gif. Public Domain.
NASA. http://commons.wikimedia.org/wiki/Image:Atmospheric_ozone.svg. Public Domain NASA.
http://www.flickr.com/photos/smudger888/118152020/. (a)Public Domain (b)CC-BY.
http://commons.wikimedia.org/wiki/Image:Venuspioneeruv.jpg.
CK-12 Foundation. http://commons.wikimedia.org/wiki/File:Phanerozoic_Biodiversity.png. CC-BY-SA-2.5, 2.0, 1.0.
US EPA. http://www.sbcapcd.org/sbc/climatechange.htm. Public Domain.
http://commons.wikimedia.org/wiki/Image:Lovci_mamutu_mammoth.jpg http://commons.wikimedia.org/wiki/File:Dodo_1.JPG http://commons.wikimedia.org/wiki/Image:Bufo_periglenes1.jpg. (a) Public Domain (b) CC-BY-SA-2.5 (c) GNU-FDL (d) Public Domain.
Zakuragi. http://commons.wikimedia.org/wiki/Image:Costaricamap.png. GNU-FDL.
http://en.wikipedia.org/wiki/Image:No_till_farming_USDA.jpg. Public Domain, Public Domain.
NASA. http://commons.wikimedia.org/wiki/Image:Min_ozone.jpg. Public Domain-US Government-NASA.
User Omegatron. http://commons.wikimedia.org/wiki/Image: World_energy_usage_width_chart.svg. CC-BY-SA-3.0, 2.5, 2.0, 1.0.
http://en.wikipedia.org/wiki/Image:Iwimi.jpg. Public Domain.
Earth Observations Laboratory, Johnson Space Center. http://commons.wikimedia.org/wiki/File: Cyclone_Catarina_from_the_ISS_on_March_26_2004.JPG. Public Domain.
http://commons.wikimedia.org/wiki/Image: Green_Roof_at_Vend%C3%A9e_Historial%2C_les_Lucs.jpg. (a) CC-BY-SA-2.5,2.0,1.0 (b) Public Domain.
Craig Mayhew and Robert Simmon, NASA GSFC. http://commons.wikimedia.org/wiki/Image:Earthlights_dmsp.jpg. Public Domain NASA.
http://commons.wikimedia.org/wiki/Image:
Dust_Bowl_-_Dallas%2C_South_Dakota_1936.jpg. (a)Public Domain (b)Public Domain.
http://ga.water.usgs.gov/edu/waterdistribution.html. Public Domain.
Environmental Protection Agency (EPA).
http://en.wikipedia.org/wiki/Image:Origins.gif. Public Domain.
Barbara Akre. http://en.wikipedia.org/wiki/Biodiversity.
Rich Anderson. http://commons.wikimedia.org/wiki/Image:Monitor_in_gutter.jpg. CC-BY-SA-2.0.
//www.nasa.gov/centers/goddard/news/topstory/2007/aerosol_dimming.html. Public Domain US Gov NASA.
Robert A. Rohde. http://en.wikipedia.org/wiki/Image:Phanerozoic_Climate_Change.png. GFDL.
http://commons.wikimedia.org/wiki/Image:Pollution_over_east_China.jpg. Public Domain US Government, NASA.
Robert A. Rohde. http://commons.wikimedia.org/wiki/Image:Greenhouse_Gas_by_Sector.png. GNU-FDL.
Nino Barbieri. http://commons.wikimedia.org/wiki/Image: Pollution_-_Damaged_by_acid_rain.jpg. GFDL.
Daniel Case. http://commons.wikimedia.org/wiki/Image:Zebra_mussel_warning_sign.jpg. GFDL.
http://commons.wikimedia.org/wiki/Image:2006-01-21_Detaching_drop.jpg. GFDL.
SG. http://commons.wikimedia.org/wiki/Image:
Energy-consumption-per-capita-2003.png. GFDL, CC-BY-SA-2.5.
Robert A. Rohde. http://commons.wikimedia.org/wiki/Image:Global_Warming_Map.jpg. GNU-FDL.
http://commons.wikimedia.org/wiki/Image:Plants_diversity.jpg. CC-BY-SA-3.0, CC-BY-SA-3.0, 2.5, 2.0, 1.0.
http://commons.wikimedia.org/wiki/Image:Coral_Garden.jpg http://commons.wikimedia.org/wiki/File:Blue_Linckia_Starfish.JPG http://commons.wikimedia.org/wiki/Image: Rain_Forest_of_El_Yunque%2C_Puerto_Rico.jpg http://commons.wikimedia.org/wiki/Image:Forest_on_Barro_Colorado.png. (a)Public Domain (b)CC-BY-SA-2.0 (c)CC-BY-SA(d)Public Domain (e) CC-BY-2.5.
http://commons.wikimedia.org/wiki/Image:Kissing_Prairie_dog_edit_3.jpg http://commons.wikimedia.org/wiki/Image:Andropogon_gerardii.jpg http://commons.wikimedia.org/wiki/Image: Yellow_Coneflower_Echinacea_paradoxa_Twisted_Pair_DoF_2000px.jpg http://commons.wikimedia.org/wiki/Image: Monarch_Butterfly_Danaus_plexippus_Purple_Coneflower_3008.jpg http://commons.wikimedia.org/wiki/Image:Bouteloua_gracilis.jpg http://en.wikipedia.org/wiki/Image: Tallgrass_Prairie_Nature_Preserve_in_Osage_County.jpg. (a)Public Domain (b)CC-BY-SA-2.5, 2.0, 1.0 (d)Public Domain (e)GNU-FDL (f)GNU-FDL (g)Public
Domain (h)Public Domain.
http://commons.wikimedia.org/wiki/Image:Pollution_de_l%27air.jpg. (a) Public Domain-User (b) Public Domain-Self.
User Arnejohs. http://en.wikipedia.org/wiki/Image:Atlantic_cod_capture_1950_2005.png. Public Domain.
http://commons.wikimedia.org/wiki/Image:160658main2_OZONE_large_350.png. Public Domain US-Government-NASA.
Barbara Gavin Akre, using data from Carrol Henderson, “Minnesota to Costa Rica: The Rain Forest Connection.” Minnesota Volunteer, April 1988. Published by the Minnesota Department of Natural Resource. http:
Keel-billed_toucan%2C_costa_rica.jpg http://commons.wikimedia.org/wiki/Image:Rubythroathummer65.jpg http://commons.wikimedia.org/wiki/Image:Two-toed_sloth_Costa_Rica.jpg http://commons.wikimedia.org/wiki/Image:Bat_flying_at_night.png http://commons.wikimedia.org/wiki/Image:Blue_morpho_butterfly.jpg http://commons.wikimedia.org/wiki/Image:Cypripedium_reginae.jpg http://commons.wikimedia.org/wiki/Image:Strangler_fig_kerala.jpg. (a)Public Domain (b)Public Domain (c)CC-BY-3.0, 2.5, 2.0, 1.0 (d)Public Domain (e)CC-BY-2.5 (f)CC-BY-2.5 (g)GFDL (h)GFDL (i)CC-BY-2.5.
CK-12 Foundation. http://commons.wikimedia.org/wiki/Image:Harare_secondst.jpg http://commons.wikimedia.org/wiki/Image:Ostracion_cubicus.jpg. CC-BY-SA (a)CC-BY-2.5 (b) CC-BY-SA-2.5,2.0,1.0 (c) CC-BY-2.5.
Keith Weller of Agricultural Research Service.
http://commons.wikimedia.org/wiki/Image:GEM_corn.jpg. Public Domain.
http://commons.wikimedia.org/wiki/Image:Plumpollen0060.jpg http://commons.wikimedia.org/wiki/Image:Animal_marinho1813.JPG http://commons.wikimedia.org/wiki/Image:CabbagepestsRetouched.png http://commons.wikimedia.org/wiki/Image: Falco_peregrinus_nest_USFWS_free.jpg. (a)Public Domain (b)GNU-FDL (c)GNU-FDL (d)CC-BY-SA-2.5 (e)Public Domain.
N. Reto Stöckli. http://commons.wikimedia.org/wiki/Image:Earth_Western_Hemisphere.jpg. Public Domain US Government, NASA.
http://commons.wikimedia.org/wiki/File:Carbon_Dioxide_400kyr.png. (a)GNU-FDL (b)GNU-FDL.
Holger K. http://commons.wikimedia.org/wiki/File:Stagnogley.JPG. Public Domain.
http://commons.wikimedia.org/wiki/Image:Caspian_Sea_from_orbit.jpg. (a)Public Domain (b)Public Domain.
http://commons.wikimedia.org/wiki/Image:Acid_rain_woods1.jpg. Public Domain.
Robert A. Rohde. http://commons.wikimedia.org/wiki/Image:Global_Warming_Predictions.png. GNU-FDL.
(46) . (a) CC-BY-SA-2.5 (b) GFDL (c) CC-BY-SA-2.5 (d) CC-BY-SA-2.5, 2.0, 1.0.
http://www.gsfc.nasa.gov/topstory/20020926landcover.html. Public Domain.
United States Department of Agriculture. http://commons.wikimedia.org/wiki/Image:National_Organic_Program.jpg. Public Domain.
http://commons.wikimedia.org/wiki/Image:TOMS_Global_Ozone_65N-65S.png. Public Domain-US Government-NASA.
Robert A. Rohde. http://commons.wikimedia.org/wiki/Image: Instrumental_Temperature_Record.png. GNU-FDL.
http://commons.wikimedia.org/wiki/Image:Vostok-ice-core-petit.png. GFDL.
http://commons.wikimedia.org/wiki/File:Lacanja_burn.JPG. Public Domain.
Wagner Christian. http://commons.wikimedia.org/wiki/Image:Windenergy.jpg. CC-BY-SA-2.5.
NASA. http://commons.wikimedia.org/wiki/Image:Ozone_cycle.jpg. Public Domain-US Government-NASA.
Robert A. Rohde. http://commons.wikimedia.org/wiki/Image: Instrumental_Temperature_Record.png. GNU-FDL.
http://commons.wikimedia.org/wiki/Image:Recent_Sea_Level_Rise.png. (a)GNU-FDL (b)GNU-FDL.
Anthony Bley, U.S. Army Corps of Engineers. http://commons.wikimedia.org/wiki/File:Wetlands_Cape_May_New_Jersey.jpg. Public Domain US Army USACE.
Johann Dréo. http://commons.wikimedia.org/wiki/Image:Sustainable_development.svg. CC-BY-SA-2.0.
http://commons.wikimedia.org/wiki/Image:Darfur_IDPs_1_camp.jpg. Public Domain.
http://en.wikipedia.org/wiki/Image:Waterspecies.gif. Public Domain-US Government-EPA.
http://en.wikipedia.org/wiki/Image:Available_Energy-2.jpg. GNU-FDL, CC-BY-2.5.
- Log in or register to post comments
- Email this page