Lesson 18.3: Natural Resources II: The Atmo- sphere
Lesson 18.3: Natural Resources II: The Atmo- sphere
Lesson Objectives
Recognize that the Earth’s atmosphere provides conditions and raw materials essential for life.
Review the changes in the atmosphere over the history of the Earth.
Describe the dynamic equilibrium which characterizes the natural atmosphere.
Analyze the ways in which population growth, fossil fuel use, industrialization, tech- nology, and consumption result in atmospheric changes.
Explain the effects of these changes on ecosystems.
Relate these effects to current global stability.
Describe how human activities including technology affect ecosystem services such as:
nutrient cycling
hydrologic cycle
waste disposal
Evaluate the effects of changes in these services for humans.
Identify the ways in which humans have altered the air for other species.
Relate air pollution to ecosystem loss.
Interpret the effects of air pollution on biodiversity.
Define acid rain.
List the natural and anthropogenic causes of acid rain.
Identify the effects of acid rain.
Discuss solutions specific to the problem of acid rain.
Locate and describe the origin of the ozone layer.
Distinguish between ozone depletion and the ozone hole.
Explain the role of ozone in absorbing ultraviolet radiation.
Indicate the ways in which the ozone layer varies naturally.
Discuss the relationship between recent changes in the ozone layer and human activities.
Describe the measures taken to restore the ozone layer and evaluate their effectiveness.
Introduction
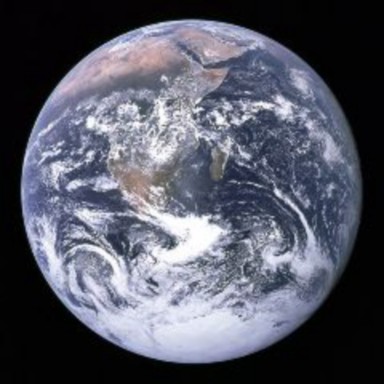
Air: so easy to take for granted. In its pristine state, we cannot see it, smell it, taste it, feel it, or hear it, except when the wind blows or clouds form. Yet its complex and dynamic mix of gases is essential for life. Nitrogen (78%) provides atoms which build proteins and nucleic acids via the nitrogen cycle. Oxygen (21%) permits the production of the ATP through cellular respiration, to power life. Carbon dioxide (.04%) provides the carbon for carbohydrate fuels and carbon skeletons to build life’s bodies. Water (1-4% near the Earth’s surface) has so many unique properties (adhesion, surface tension, cohesion, capillary action, high heat capacity, high heat of vaporization…and more) that it is difficult for us to imagine any form of life on any planet which does not depend on it. As a major component of the hydrologic cycle, the atmosphere cleans and replenishes Earth’s fresh water supply, and refills the lakes, rivers, and oceans habitats for life (Figure 18.35). The Earth’s atmosphere thins but reaches away from its surface for 100 kilometers toward space; between about 15 and 35 km lies the Ozone Layer – just a few parts per million which shields life from the sun’s damaging Ultra-Violet radiation. Earth’s atmosphere appears ideal for life, and indeed, as far as we know it is the only planetary atmosphere which supports life.
As we noted in the History of Life chapter, the Earth’s atmosphere has not always been this hospitable for life. Life itself is probably responsible for many dramatic changes, including the addition of oxygen by photosynthesis, and the subsequent production of ozone from accumulated oxygen. Changes in CO2 levels, climate, and sea level have significantly altered conditions for life, even since the addition of oxygen some 2 billion years ago. On a daily time scale, dramatic changes take place:
most organisms remove O2 and add CO2 through cellular respiration
most autotrophs remove CO2 and add O2 through photosynthesis
plants transpire vast quantities of water into the air
precipitation returns it, through gentle rains or violent storms, to the Earth’s surface
On a human time scale, the daily dynamics balance, and the atmosphere remains at equi- librium – an equilibrium upon which most life depends.
Upsetting the Equilibrium of the Atmosphere: Air Pollution
Despite the atmosphere’s apparent vastness, human activities have significantly altered its equilibrium in ways which threaten its services for life. Chemical substances, particulate matter, and even biological materials cause air pollution if they modify the natural char- acteristics of the atmosphere. Primary pollutants are directly added to the atmosphere by processes such as fires or combustion of fossil fuels (Figure 18.36). Secondary pollu- tants, formed when primary pollutants interact with sunlight, air, or each other, can be equally damaging. The chlorine and bromine which threaten the Ozone Layer are sec- ondary pollutants, formed when refrigerants and aerosols (primary pollutants) decompose in the stratosphere (Figure 18.37).
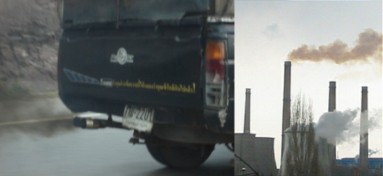
The majority of air pollutants can be traced to the burning of fossil fuels. We burn fuels in power plants to generate electricity, in factories to power machinery, in stoves and furnaces for heat, in airplanes, ships, trains, and motor vehicles for transportation, and in waste facilities to incinerate waste. Since long before fossil fuels powered the Industrial Revolution, we have burned wood for heat, fireplaces, and campfires and vegetation for agriculture and land management. The resulting primary and secondary pollutants and the problems to which they contribute are included in Table 18.2.
![]()
Pollutant Example/Major Source Problem
![]()
Sulfur oxides (SOx) Coal-fired power plants Acid Rain Nitrogen oxides (NOx) Motor vehicle exhaust Acid Rain Carbon monoxide (CO) Motor vehicle exhaust Poisoning Carbon dioxide (CO2) All fossil fuel burning Global Warming
Particulate matter (smoke, dust)
Wood and coal burning Respiratory disease, Global
Dimming
Mercury Coal-fired power plants, medical waste
Neurotoxicity
Smog Coal burning Respiratory problems; eye irritation
Ground-level ozone Motor vehicle exhaust Respiratory problems; eye
irritation
![]()
Beyond the burning of fossil fuels, other anthropogenic (human-caused) sources of air pollution are shown in Table 18.3.
![]()
Activity Pollutant Problem
![]()
Agriculture: Cattle Ranch- ing
Fertilizers
Herbicides and Pesticides Erosion
Methane (CH4)
Ammonia (NH3), Volatile Organic Chemi- cals(VOCs)
Persistent Organic Pollu- tants(POP): DDT, PCBs, PAHs*
Dust
Global Warming
Toxicity, Global Warming Cancer
Global Dimming
Table 18.3: (continued)
Activity Pollutant Problem
VOCs, POPs CFCs Cancer, Global Warming
Industry (solvents, plas- tics)
Refrigerants, Aerosols
Ozone Depletion
Nuclear power and defense Radioactive waste Cancer
Landfills Methane (CH4) Global Warming
Mining Asbestos Respiratory problems Biological Warfare Microorganisms Infectious Disease
Indoor Living CO, VOCs, asbestos, dust, mites, molds, particulates
Indoor air pollution
DDT = an organic pesticide; PCB = poly-chlorinated biphenyls, used as coolants and insulators; DDT and most PCBs are now banned at least in the U.S., but persist in the environment; PAHs = polycyclic aromatic hydrocarbons – products of burning fossil fuels, many linked to health problems
Many pollutants travel indoors in building materials, furniture, carpeting, paints and var- nishes, contributing to indoor air pollution. In 2002, the World Health Organization esti- mated that 2.4 million people die each year as a consequence of air pollution – more than are killed in automobile accidents. Respiratory and cardiovascular problems are the most common health effects of air pollution, but accidents which release airborne poisons (the nuclear power plant at Chernobyl, the Union Carbide explosion in Bhopal, and the “Great Smog of 1952” over London) have killed many people – and undoubtedly other animals – with acute exposure to radiation or toxic chemicals.
If you study the problems caused by air pollution (third column in the tables, above), you will note that beyond human health, air pollution affects entire ecosystems, worldwide. Acid Rain, Ozone Depletion, and Global Warming are widespread and well-recognized global concerns, so we will explore them in detail in independent sections of this lesson, – and an entire lesson on Global Warming. Effects of toxins, which poison wildlife and plants as well as humans, were addressed in discussions of soil and water pollution in the last chapter. Before we move on to the “Big Three,” let’s take a brief look at the problems caused by particulates and aerosols, since these are unique pollutants of air, rather than soil or water.
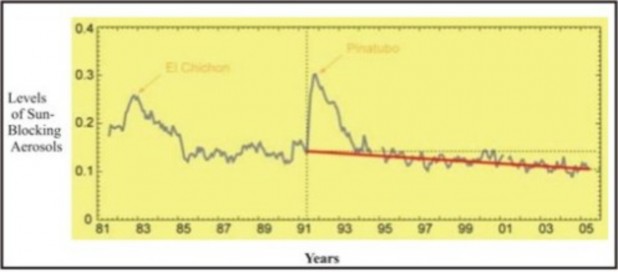
“Global dimming” refers to a reduction in the amount of radiation reaching the Earth’s surface. Scientists observed a drop of roughly 4% between 1960 and 1990, and attributed it to particulates and aerosols (in terms of air pollution, aerosols are airborne solid particles or liquid droplets). These pollutants absorb solar energy and reflect sunlight back into space. The consequences for life are many:
Less sunlight means less photosynthesis.
Less photosynthesis means less food for all trophic levels.
Less sunlight means less energy to drive evaporation and the hydrologic cycle.
Less sunlight means cooler ocean temperatures, which may lead to changes in rainfall, drought and famine.
Less sunlight may have cooled the planet, masking the effects of Global Warming.
Recent measurements of sunlight-absorbing particulates show a decline since 1990, which corresponds to a return to normal levels of radiation (Figure 18.37). These data suggest that Clean Air legislation enacted by developed nations may have improved air quality and prevented most of the above effects, at least for now. Two caveats remain:
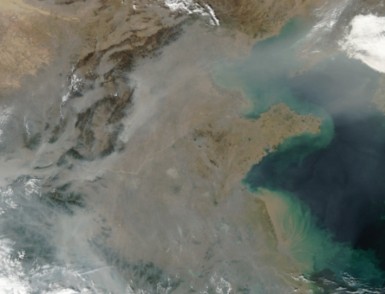
Massive waves of pollution from Asian industry have blown across the Pacific by prevailing winds (Figure 18.38). On some days, atmospheric physicists at the Scripps Institution of Oceanography have traced nearly one-third of the air over Los Angeles and San Francisco directly to Asian sources. The waves are made of dust from Asian deserts combined with pollution from increasing industrialization, making the level of particulates and aerosols in Beijing, for example, reach levels 7 times World Health Organization standards. Scientists estimate that the clouds may be blocking 10% of the sunlight over the Pacific. By seeding clouds, the aerosols and particulates may be intensifying storms. In addition to direct effects on the global atmosphere (such waves can circle the Earth in three weeks), these pollution clouds can, as we stated above, mask Global Warming.
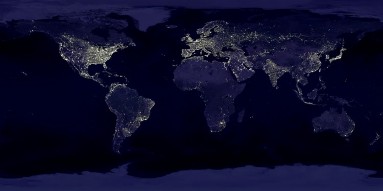
One additional topic relates to atmospheric change. Light pollution (Figure 18.39) results from humans’ production of light in amounts which are annoying, wasteful, or harmful. Light is essential for safety and culture in industrial societies, but reduction in wasteful excess could mitigate its own harmful effects, as well as the amounts of fossil fuel used to generate it. Astronomers – both amateur and professional – find light interferes with their observations of the night skies. Some studies show that artificial spectra and excessive light exposure has harmful effects on human health. Life evolved in response to natural cycles and natural spectra of light and dark, so it is not surprising that our changes in both of those might affect us and other forms of life. Light pollution can affect animal navigation and migration and predator/prey interactions. Because many birds migrate by night, Toronto, Canada has initiated a program to turn out lights at night during spring and fall migration seasons. Light may interfere with sea turtle egg-laying and hatching, because both happen on coasts at nighttime. The behavior of nocturnal animals from owls to moths can be changed by light,
and night-blooming flowers can be affected directly or through disruption of pollination. Zooplankton normally show daily vertical migration, and some data suggests that changes in this behavior can lead to algal blooms.
Solutions to problems caused by light pollution include
If “Global Dimming” did indeed mask Global Warming for 30 years, predictions about future climate change may be too conservative. Keep this in mind when we address Global Warming in the next lesson.
Population growth and industrialization of developing countries continues to increase levels of pollution.
reducing use
changing fixtures to direct light more efficiently and less harmfully
changing the spectra of light released
changing patterns of lighting to increase efficiency and reduce harmful effects
Many cities, especially those near observatories, are switching to low-pressure sodium lamps, because their light is relatively easy to filter.
Acid Rain
Do you remember the pH scale? Its range is 0-14, and 7 is neutral – the pH of pure water. You’ve probably measured the pH of various liquids such as vinegar and lemon juice, but do you know how important even very small changes in pH are for life? Your body maintains the pH of your blood between 7.35 and 7.45, and death results if blood pH falls below 6.8 or rises above 8.0. All life relies on relatively narrow ranges of pH, because protein structure and function is extremely sensitive to changes in concentrations of hydrogen ions. An important pollution problem which affects the pH of Earth’s environments is Acid Rain (Figure 18.40).
Rain, snow, fog, dew, and even dry particles which have an unusually low pH are commonly considered together as Acid Rain, although more accurate terms would be acid precipitation or acid deposition. You will remember that a pH below 7 is acidic, and the range between 7 and 14 is basic. Natural precipitation has a slightly acidic pH, usually about 5, mostly because CO2, which forms 0.04% of the atmosphere, reacts with water to form carbonic acid:
Table 18.4:
This natural chemical reaction is actually quite similar to the formation of acid rain, except that levels of the gases which replace carbon dioxide are not normally significant in the atmosphere. The most common acid-forming pollutant gases are oxides of nitrogen and sulfur released by the burning of fossil fuels. Because burning may result in several different oxides, the gases are often referred to as “NOx and SOx.” This may sound rather affectionate, but it’s more accurate to think of it as obNOXious! Whereas the carbonic acid formed by carbon dioxide is a relatively weak acid, the nitric and sulfuric acids formed by NOx and SOx are strong acids, which ionize much more readily and therefore cause more damage. The reactions given below slightly simplify the chemistry (in part because NOx and SOx are complex mixtures of gases), but should help you see the acidic results of an atmospheric mixture of water and these gases.
Table 18.5:
![]()
NO2 + OH- → HNO3 NO3- + H+
![]()
nitrogen diox- ide
hydroxide ion (from water)
nitric Acid nitrate hydrogen ion
![]()
Table 18.6:
![]()
SO3 + H2O → H2SO4 SO4-2 + 2H+
![]()
sulfur trioxide water sulfuric acid sulfate hydrogen ions
![]()
Nitrogen and sulfur oxides have always been produced in nature by volcanoes and wildfires and by biological processes in wetlands, oceans, and even on land. However, these natural levels are either limited in time or amount; they account for the slightly acidic pH of “normal” rain. Levels of these gases have risen dramatically since the Industrial Revolution began; scientists have reported pH levels lower than 2.4 in precipitation in industrialized areas.
Generation of electricity by burning coal, industry, and automobile exhaust are the primary sources of NOx an SOx. Coal is the primary source of sulfur oxides, and automobile exhaust is a major source of nitrogen oxides.
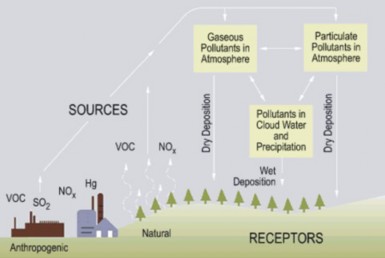
Figure 18.40: Acid rain formation begins when nitrogen and sulfur oxides (here NOx and SO2) and volatile organic compounds (VOC) from burning fossil fuels escape into the at- mosphere. When these gases or particulates combine with water – either in the atmosphere or after reaching the ground – they become acid deposition. The term acid rain commonly refers to all forms of acid deposition. (18)
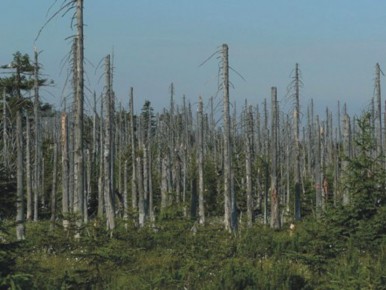
Because most life requires relatively narrow pH ranges near neutral, the effects of acid rain can be devastating. In soils, lowered pH levels can kill microorganisms directly, altering decomposition rates, nutrient cycles, and soil fertility. A secondary effect of increased acidity is the leaching of nutrients, minerals, and toxic metals such as aluminum and lead from soils and bedrock. Depletion of nutrients and mobilization of toxins weakens trees and other plants, especially at higher altitudes where higher precipitation and acid fog damage leaves and needles, as well (Figure 18.41).
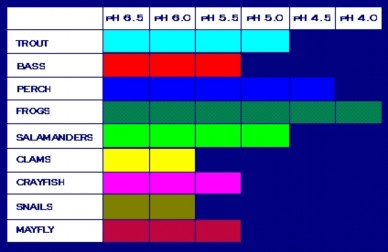
The flow of acid rain through watersheds increases acidity, nutrients, and toxins in aquatic ecosystems. Fish and insects are sensitive to changes in pH, although different species can tolerate different levels of acidity (Figure 18.42). Food chain disruption can compound even slight changes in pH; for example, acid-sensitive mayflies provide food for less-sensitive frogs. Additional nitrates in aquatic systems can lead to eutrophication and algal blooms, discussed in the last lesson.
The sensitivity of lakes, streams, and soils to damage from acid rain depends on the nature of the soils and bedrocks. Watersheds containing limestone, which can buffer (partially neutralize) the acid, are less severely affected. In addition, northern regions with long winters suffer “acid shock” when spring thaws dump months of accumulated acid precipitation into
streams and rivers. In the US, lakes and streams in the Appalachians, northern Minnesota and upper New York, and Western mountains have been more severely impacted by acid rain. According to the EPA, the pH of Little Echo Pond in New York state, 4.2, is one of the lowest in the U.S.
Another class of victims of acid rain is entirely within the realm of human culture and history. Acid’s ability to corrode metal, paints, limestone, and marble has accelerated erosion of buildings, bridges, statues, monuments, tombstones, and automobiles (Figure 18.43).

Attempts to solve the problem of acid rain began with building taller smokestacks. These only sent the polluting gases higher into the atmosphere, relieving local problems temporarily, but sending the damage to areas far from their industrial sources. Today in the U.S. and other western nations, smokestacks increasingly use “scrubbers” which remove as much as 95% of SOx from exhausts; the resulting sulfates “scrubbed” from the smokestacks can sometimes be sold as gypsum (used in drywall, plaster, fertilizer and more), but may also be landfilled. Catalytic converters and other emission control technologies remove NOx from motor vehicle exhaust. However, population growth and development throughout the world is increasing pressures to use more fossil fuels and high-sulfur coal, often without these expensive technologies.
Ozone Depletion
Many people confuse the “hole in the ozone” with “global warming.” Although the two are related in part, they are separate problems with separate effects and only partially overlapping causes, so they require separate solutions.
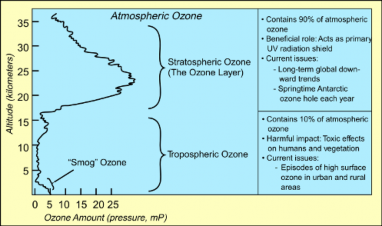
Ozone is both a threat and a gift (Figure 18.45). As a ground-level product of the interaction between sunlight and pollutants, it is considered a pollutant which is toxic to animals’ respiratory systems. However, as a component of the upper atmosphere, it has shielded us and all life from as much as 97-99% of the sun’s lethal UV radiation for as long as 2 billion years. The “hole” in the ozone develops in this thin upper Ozone Layer. How long will that protection continue? Let’s explore the problem of ozone depletion.
The Ozone (O3) Layer forms when UV radiation strikes oxygen molecules (O2) in the strato- sphere, between 15 and 35 kilometers above the Earth’s surface. Even the highest concentra- tions of ozone are only about 8 parts per million, but ever since photosynthesis oxygenated the Earth’s atmosphere, allowing ozone-forming chemical reactions, this thin Ozone Layer has shielded life from the mutagenic effects of ultraviolet radiation – especially the more damaging UV-B and UV-C wavelengths (Figure 18.44).
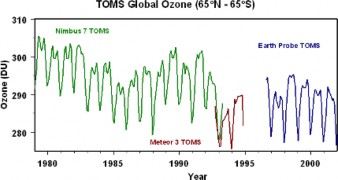
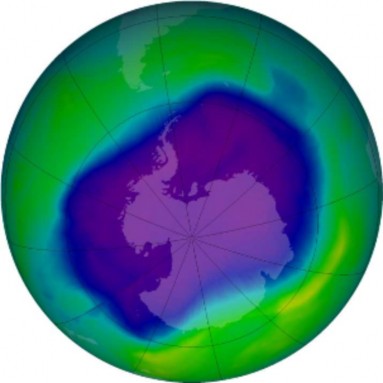
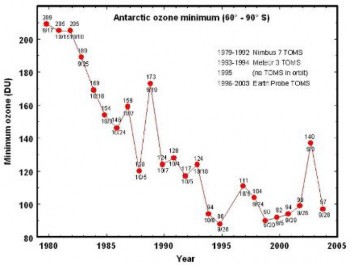
The thickness of the Ozone Layer varies seasonally and across the Earth – thicker in Spring than in Autumn, and at the Poles compared to near the Equator. Ozone depletion de- scribes two related declines in stratispheric ozone. One is loss in the total amount of ozone in the Earth’s stratosphere – about 4% per year from 1980 to 2001 (Figure 18.47). The sec- ond, much larger loss refers to the ozone hole – a seasonal decline over Antarctica (Figures
and 14), which has now lost as much as 70% of pre-1975 ozone levels. A much smaller “dimple” overt the North Pole has also shown a 30% decline. The Antarctic ozone hole occasionally affects nearby Australia and New Zealand after annual breakup. A secondary effect is the decline in stratosphere temperatures, because when ozone absorbs UV radiation, it is transformed into heat energy.
The causes of ozone depletion are gases which unbalance the ozone cycle (Figure 18.46)
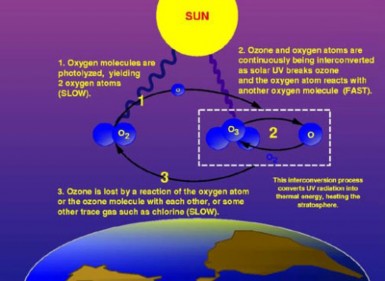
toward the breakdown of ozone. Chlorine and bromine gases have increased due to the use of chlorfluorocarbons (CFCs) for aerosol sprays, refrigerants (Freon), cleaning solvents, and fire extinguishers. These ozone-depleting substances (ODS) escape into the stratosphere, and when UV radiation frees chlorine and bromine atoms, these unstable atoms break down ozone. Scientists estimate that CFCs take 15 years to reach the stratosphere, and can remain active for 100 years. Each chlorine atom can catalyze thousands of ozone breakdown reactions.
Ozone depletion and the resulting increase in levels of UV radiation reaching earth could have some or all of the following consequences:
effects on human health
increase in skin cancers, including melanomas
increased incidence of cataracts
decreased levels of vitamin A
possible increase in levels of vitamin D produced by the skin
reduced abundance of UV-sensitive nitrogen-fixing bacteria
loss of crops dependent on these bacteria
disruption of nitrogen cycles
loss of plankton (supported by a supernova-related extinction event 2 million years ago)
disruption of ocean food chains
Most of these effects are based on the ability of UV radiation to alter DNA sequences. It is this potential which has made the Ozone Layer such a gift to life ever since photosynthesis provided the oxygen to fuel its production. Its total loss would undoubtedly be devastating to nearly all life.
In 1987, 43 nations agreed in the Montreal Protocol to freeze and gradually reduce production and use of CFCs. In 1990, the protocol was strengthened to seek elimination of CFCs for all but a few essential uses. Today, Hydrochlorofluorocarbons (HCFCs – similar compounds which replace one chlorine with a hydrogen) have replaced CFCs, with only 10% of their ozone-depleting activity levels. Unfortunately, HCFCs are greenhouse gases (see next lesson), so their role as alternatives is a mixed blessing. HFCs (hydrofluorocarbons) are another substitute; because these contain no chlorine, they have no ozone-depleting activity, and their greenhouse effect is less than HCFCs (though still significant). One HFC is currently used in automobile air conditioners in the U.S.
If ozone-depleting substances have been virtually eliminated, is ozone depletion no longer a problem?
Unfortunately, we have not yet reached that point. Levels of CFCs in the atmosphere are beginning to decline, and ozone levels appear to be stabilizing (Figures 18.47 and 14) for years after 2000). Scientists predict that ozone levels could recover by the second half of this century; the delay is due to the long half-life of CFCs in the stratosphere. However, recovery could be limited or delayed by two unknowns:
Preventing Air Pollution
Throughout this lesson, we have discussed solutions to specific problems for our atmosphere. A quick recap of ways to maintain our atmosphere and its ecosystem services from this chapter includes:
Developing countries outside the Montreal Protocol could increase their use of CFCs.
According to scientists, global warming would cool the stratosphere and increase ozone depletion because cooler temperatures favor ozone decomposition.
Reducing use of fossil fuels
Switching to cleaner fuels, such as nuclear power
Switching to renewable energy sources
Increasing fuel efficiencies
Supporting legislation for fuel efficiencies
Supporting national and international agreements to limit emissions
Utilizing pollution control technologies: e.g., scrubbers on smokestacks and catalytic converters for motor vehicles
Creating and supporting urban planning strategies
As always, costs are high and tradeoffs must be considered. The classic example is nuclear power, whose effects on the atmosphere are less than those of fossil fuels. Unfortunately, it has high potential for health damage and high costs – both economic and environmental – for storage and transport of nuclear waste.
Because fossil fuel use is the cause of so many atmospheric as well as water and soil pollutants, the solutions mentioned in the last two lessons apply here, as well. The final lesson on Climate Change relates directly to both fossil fuel combustion and atmospheric change, so more pollution solutions, specific to climate change, will be presented. You should also review the individual responses at the end of the lesson on biodiversity, because that list focuses on ways you can change your own life to help protect the environment.
Lesson Summary
Earth’s atmosphere, as we understand it today, provides ideal conditions and essential raw materials for life.
Throughout Earth’s history, the atmosphere has changed dramatically, and life caused some of the changes.
Within human history, the atmosphere had been in a dynamic equilibrium: balancing photosynthesis, respiration, evaporation, and precipitation.
Primary pollutants are directly added to the atmosphere by processes such as fires or combustion of fossil fuels. Secondary pollutants are formed when primary pollutants interact with sunlight, air, or each other.
The majority of air pollutants can be traced to the burning of fossil fuels for heat, electricity, industry, transportation, and waste disposal.
Worldwide, air pollution causes as many as 2.4 million deaths each year.
Aerosols (particulates and liquid droplets) cab cause global dimming, or reduction in sunlight reaching the Earth.
Light pollution can interfere with bird migrations, sea turtle reproduction, nocturnal animal behavior, and human activity.
Rain, snow, fog, dew, and even dry particles which have an unusually low pH are commonly considered together as Acid Rain.
Normal rain has a pH of about 5, due in part to formation of a weak (carbonic) acid from CO2.
Burning fossil fuels adds NOx and SOx gases to the atmosphere; these form strong
acids (nitric and sulfuric) and change the pH of rain to as low as 2.4.
Acid rain leaches nutrients and toxins from soils, weakening forests and killing aquatic animals.
Limestone in bedrock or watersheds buffers the effects of acid rain for certain lakes.
The development of taller smokestacks only sent pollution elsewhere, but scrubbers in smokestacks and catalytic converters in motor vehicles help to reduce emissions.
The Ozone Layer in the stratosphere – formed from O2 – protects Earth’s life from
mutagenic UV radiation.
Ground-level ozone – formed from automobile exhaust and industry – is a component of smog, which irritates eyes and respiratory membranes.
Ozone depletion is a global reduction in the thickness of the ozone layer, caused by chlorine and bromine atoms which reach the stratosphere.
The ozone hole is a seasonal thinning of ozone above the Antarctic.
CFCs in aerosol sprays, refrigerants (Freon), cleaning solvents, and fire extinguishers are the primary ozone-depleting substances (ODSs).
The 1987 Montreal Protocol has reduced the use of CFCs and ozone depletion.
Chemical substitutes, though less harmful, still cause damage, and countries outside the Protocol may still add ODS to the atmosphere.
Global warming would cool the stratosphere and increase ozone depletion, because cooler temperatures favor ozone decomposition.
Because fossil fuels are the source of many air pollutants, reducing their use is the key to solving air pollution problems.
Technology can help by developing alternative energy sources, increasing fuel efficien- cies, and improving pollution control.
Governments can help by legislating fuel efficiencies and pollution control, urban plan- ning, and forging agreements with other governments.
Review Questions
Further Reading / Supplemental Links
Summarize the importance of the gaseous “life support system” which Earth’s atmo- sphere provides, and the dynamic equilibrium which characterizes the natural atmo- sphere.
Describe the ecosystem services provided by Earth’s atmosphere.
Distinguish between primary and secondary pollutants, and give an example of each.
Define acid rain and trace the steps in its formation.
Why is rain with a pH of 5 not considered acid rain?
Analyze the effects of acid rain on soils, water resources, vegetation, animals, and humans.
Define ozone depletion and explain its causes.
Explain the consequences of ozone depletion.
Chart the air pollution problems discussed in this chapter together with a primary cause and an important prevention practice for each.
Table 18.7:
Problem Major Cause Major Prevention Practice Global Dimming Dust from erosion Contour plowing, conserva-
tion tillage, cover crops
Light Pollution Urbanization, artificial lights
Alteration of spectra and de- sign of lights
Smog Automobile exhaust Catalytic converters, emis- sions control
Acid Rain Generation of electricity from coal
Reduce use, scrubbers
Ozone Depletion CFC emission Eliminate use, find substi-
tutes
![]()
Why are international treaties, such as the Montreal Protocol and the Kyoto Treaty, so important in solving air pollution problems?
US Environmental Protection Agency, Effects of Acid Rain - Surface Waters and Aquatic Animals, ACID RAIN, US EPA website, last updated 8 June 2007. Available online at:
http://www.epa.gov/acidrain/effects/surface_water.html
http://www.epa.gov/highschool/air.htm
http://www.anr.state.vt.us/site/html/reflect/April5.htm
http://www.atm.ch.cam.ac.uk/tour/
http://www.pbs.org/wgbh/nova/sun/
http://www.documentary-film.net/search/sample.php
http://www.skyandtelescope.com/resources/darksky
http://www.wellesley.edu/Biology/Faculty/Mmoore/Content/Moore_2000.pdf
Vocabulary
acid rain Precipitation in any form which has an unusually low pH.
aerosols Airborne solid particles or liquid droplets.
air pollution Alteration of the Earth’s atmosphere by chemical, particulate, or biological materials.
algal bloom A rapid increase in the growth of algae, often due to a similar increase in nutrients.
anthropogenic sources Sources of pollution related to human activities.
biodiversity Variation in life – at all levels of organization: genes, species, and ecosystems.
ecosystem A functional unit comprised of living things interacting with their nonliving environment.
eutrophication An increase in nutrient levels in a body of water, often followed by an increase in plant or algae production.
global dimming A reduction in the amount of radiation reaching the Earth’s surface.
global warming The recent increase in the Earth’s average near-surface and ocean tem- peratures.
greenhouse effect The trapping by the atmosphere of heat energy radiated from the Earth’s surface.
light pollution Production of light by humans in amounts which are annoying, wasteful, or harmful.
nonpoint source pollution Runoff of nutrients, toxins, or wastes from agricultural, min- ing, construction, or developed lands.
ozone depletion Reduction in the stratospheric concentration of ozone molecules, which shield life from damaging ultraviolet radiation.
ozone hole A seasonal reduction in ozone levels over Antarctica.
ozone layer A concentration of ozone molecules located between 15 and 35 kilometers above Earth’s surface in the stratosphere.
point source pollution Single site sources of nutrients, toxins, or waste, such as industrial or municipal effluent or sewer overflow.
pollution Release into the environment of chemicals, noise, heat or even light beyond the capacity of the environment to absorb them without harmful effects on life.
primary pollutants Substances released directly into the air by processes such as fire or combustion of fossil fuel.
secondary pollutants Substances formed when primary pollutants interact with sunlight, air, or each other.
sustainable use Use of resources at a rate which meets the needs of the present without impairing the ability of future generations to meet their needs.
Points to Consider
What are the major ecosystem services provided by our atmosphere?
Could you now explain to a friend or family member the difference between the “hole in the ozone” and “global warming”?
In what ways have we already begun to add the costs of atmospheric changes to our economic system?
Can you think of additional ways in which we could build in these costs?
How can we gain support for adding environmental costs to economic costs?
- Log in or register to post comments
- Email this page