Lesson 26.1 Investigation and Experimentation Activities
Lesson 26.1 Investigation and Experimentation Activities
26.1 Investigation and Experimentation Activities
The following activities are based on information provided within this FlexBook or taken directly from the Teacher Edition.
Collecting and Analyzing Data
In this activity students will select and use appropriate tools and technology to perform tests, collect data, analyze relationships, and display data.
Students build skills in interpreting data and measuring through a simple activity. Have students measure a certain volume of water into a number of cups, such as 4 - 10 cups. Then have them first look online for what the threshold amount is for detecting sugar in water (see:http://www.skidmore.edu/~hfoley/Perc2.htm#ch2demo1).
Have one cup with water only (the control), and then have students add increasing amounts of sugar to each of the remaining cups. Keep track of the amount of sugar added. Have a person record for each student the threshold when that student detects the sugar (by taste) in the solution. The results are then tabulated and a graph made showing the number of students detecting the sugar solution at each concentration.
Experimental Error and Inconsistent Results
Students will identify and communicate sources of unavoidable experimental error and de- termine possible reasons for inconsistent results, such as sources of error or uncontrolled conditions.
As an extension to the above activity, have students conduct an experiment with the same amount of sugar and water in each cup. Use an amount in which the sugar is detectable. Ask students to determine if there is the same or different amounts of sugar. Some students will determine that there are different amounts of sugar in the cups. Discuss the possible reasons for these results and how inconsistent results can influence collected data. You may choose to have one group of students set up the experiment for you (these students will not participate in the collection of data), with another group blind to the experimental conditions.
Experimental Error
An error is a boundary on the precision and accuracy of the result of a measurement. Some errors are caused by unpredictable changes in the measuring devices (such as balances, rulers, or calipers), but other errors can be caused by reading a measuring device incorrectly or by using broken or malfunctioning equipment. Such errors can have an impact on the reliability of the experiment’s results; they affect the accuracy of measurements. For example, you use a balance to obtain the mass of a 100 gram block. Three measurements that you get are:
g, 92.0 g, and 91.8 g. The measurements are precise, as they are close together, but they are not accurate.
If the cause of the error can be identified, then it can usually be eliminated or minimized. Reducing the number of possible errors by careful measurement and using a large enough sample size to reduce the effect of errors will improve the reliability of your results.
Have students discuss potential opportunities for experimental error in the above activity, and have them describe how they could have affected the experimental results. Have the class discuss controls they could have added to this test to reduce experimental error.
Scientific Models
During this activity, students should realize that appropriate tools and technology (such as computer-linked probes, spreadsheets, and graphing calculators) are used to perform tests, collect data, analyze relationships, and display data. Throughout this activity, students should also recognize both the usefulness and limitations of scientific models, and that models are a scientific representations of reality.
Have the students look at the figure below and discuss: 1. What kind of model this is (computer). 2. What this model is used for (to forecast wind speeds and directions). 3. How this model might be useful (for example, weather forecasts; airline routes). 4. What is the main advantage of this visual model to the public (much easier to understand than a large table of numbers)? 5. Also ask the students how this model (and models in general) are of use to scientists (for example, reflecting reality, predicting future observations, ease of use and how it looks [for example, the colors used]).
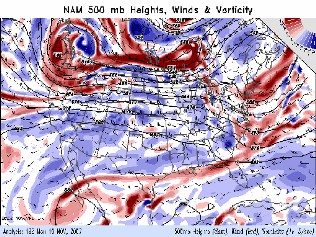
A computer model of wind patterns across the continental United States for 19 November, 2007. This model is used to forecast wind speeds and directions. Data on wind speed, direction, and related data are entered into a computer which then produces this simulation. This visual model is much easier for a person to understand than a large table of numbers.
Scientific Logic
During this activity students will formulate explanations by using logic and evidence. They will also use appropriate tools and technology to display data.
Have students come up with data online or do their own activity to generate data. Have the activity illustrate the area of biological study known as physiology. Have students work in pairs. Have the students take turns taking their pulses after sitting (pulse at resting), and then after jumping up and down after a time period, perhaps one to two minutes. Take pulses at varying times after the activity; immediately after, one minute after, two minutes after, etc. Data could be examined in a number of ways; how resting pulse compares to pulse right after the activity, at varying times after the activity, how long it might take to get back to a resting pulse, the differences in pulses between boys and girls, how pulse rate increases with how much time a person jumps (one minute vs. two minutes, etc.). Data could be presented in either graph or table form, or both. Have students come to a conclusion based on their results. The conclusion should be based on their evidence and scientific logic.
Science and Math
During this activity students need to understand the relationship between science and math.
Using a hypothetical rabbit population at Hardy-Weinberg equilibrium, have students de- termine both the allele frequencies and the genotype frequencies. This rabbit population has 9 albino rabbits and 91 brown rabbits (42 homozygous and 49 heterozygous rabbits).
Solution
Instructors: Sample answers to these questions will be provided upon request. Please send an email to teachers-requests to request sample answers.
Statistical Variability
Students will recognize the importance of statistical variability.
Biodiversity
Use activity 1 at the web site below to introduce the concept of biodiversity and how it is measured. In the activity, students calculate a diversity index for each of several different “habitats,” represented by plastic bottles that contain a variety of different dried beans, seeds, or other small items. Then, based on its diversity index, students decide what type of real-world habitat each bottle “habitat” best represents.
http://www.accessexcellence.org/AE/ATG/data/released/0534-KathyParis/index. php
In this activity students use math to calculate the diversity index of a selected habitat. The closer to 1 the diversity index is, the more diverse and healthy the habitat is.
Hypothesis vs. Theory
Ask students to develop a scientific hypothesis. They may use the activity below.
During this activity students should discuss the difference between their hypothesis and a scientific theory, describing why their hypothesis is not a theory. They should also appreciate the usefulness and limitations of theories as scientific representations of reality.
Formulating a Hypothesis
Scientific Theory
Scientific theories are hypotheses which have stood up to repeated attempts at falsification and are thus supported by a great deal of data and evidence. Some well known biological theories include the theory of evolution by natural selection, the cell theory (the idea that all organisms are made of cells), and the germ theory of disease (the idea that certain microbes cause certain diseases). The scientific community holds that a greater amount of evidence supports these ideas than contradicts them, and so they are referred to as theories.
In every day use, people often use the word theory to describe a guess or an opinion. For example, “I have a theory as to why the light bulb is not working.” When used in this common way, “theory” does not have to be based on facts, it does not have to be based on a true description of reality. This usage of the word theory often leads to a misconception that can be best summed up by the phrase ”It’s not a fact, it’s only a theory.” In such everyday usage, the word is most similar to the term hypothesis.
Scientific theories are the equivalent of what in everyday speech we would refer to as facts. In principle, scientific theories are always subject to corrections or inclusion in another, wider theory. As a general rule for use of the term, theories tend to deal with broader sets of phenomena than do hypotheses, which usually deal with much more specific sets of phenomena or specific applications of a theory.
When Data Does Not Fit
Students will understand that some observations may be wrong or fraudulent, and that some- times a theory can be wrong.
Refer students to the proposals of Jean-Baptiste Lamarck. He proposed that acquired char- acteristics could be inherited. Evidence did not support his mechanism for change, but Darwin shared his ideas of change in species.
A few websites are provided for additional information about Lamarck.
http://www.ucmp.berkeley.edu/history/lamarck.html
http://www.mnsu.edu/emuseum/information/biography/klmno/lemarck_jean.html
Maps
In this activity, students will learn the relationship between science and maps. Students should examine the maps below and determine what the data depicts.
Stabilizing Selection and Sickle-Cell Anemia
Stabilizing selection can lead to the preservation of harmful alleles. A famous example is sickle-cell anemia. The gene for Beta-hemoglobin - half of the oxygen-carrying protein in our blood - has two alleles, which we will call Hgb-A and Hgb-S. Individuals having two copies of the Hgb-S allele suffer from sickle-cell anemia, a potentially lethal disease in which sickled cells clog capillaries and cannot carry oxygen efficiently. In equatorial regions, individuals with two copies of Hgb-A become infected with Plasmodium parasites and often die from malaria. However, individuals with one copy of each allele (the heterozygous genotype) escape both causes of death; although they may experience slight sickling at high altitudes, they do not suffer from full-blown anemia, and malaria parasites cannot infect their red blood cells. Stabilizing selection has maintained the frequencies of both alleles, even though each is potentially lethal in the homozygous state.
Solution
Instructors: Sample answers to these questions will be provided upon request. Please send an email to teachers-requests to request sample answers.
Analysis of Natural Phenomena
Through a series of activities, students will understand that the analysis of locations, se- quences, or time intervals have played a significant role in the analysis of scientific data.
Virtual Age Dating
Assign the animated activity Virtual Age Dating at the web site below. Students will learn more about radioactive decay and radiometric dating of fossils and then simulate the collection and analysis of radiometric data. The activity includes questions for students to check their understanding as they proceed.
http://www.indiana.edu/~ensiweb/virt.age.html
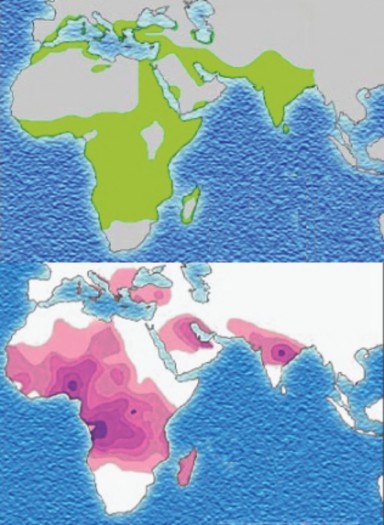
Figure 26.1: The distribution of malaria (top) and the distribution of the sickle-cell allele (bottom).? )
Geologic Timestring
Construct a geologic timestring (see URL below) that students can refer to as they read about evolution in this and subsequent lessons. The timestring is a physical representation of the geologic time scale. It is a simple tool that will help students comprehend the immensity of Earth’s history and how recently life evolved.
http://www.accessexcellence.org/AE/AEPC/WWC/1995/geo_time.php
Macroevolution: Patterns, Trends, and Rates of Change
After you discuss gradualism and punctuated equilibrium, ask students to complete the activity Macroevolution: Patterns, Trends, and Rates of Change (see URL below). In the activity, students will examine and graph patterns of fossil sequences and will decide whether the patterns support a gradualism or punctuated equilibrium model of evolution.
http://www.indiana.edu/~ensiweb/lessons/macroev.html
An Accumulation of Evidence
Students will understand the cumulative nature of scientific evidence.
Evidence of Evolution
Refer students to Lesson 12.2: Evidence for Evolution.
Have them create an outline of the lesson content or write an essay discussing the different types of evidence of evolution. All students should include a conclusion tying the evidence together, and discussion why this accumulation of evidence is a scientific theory.
Additional Scientific Disciplines
In this discussion and research project, students will analyze situations and solve problems that require combining and applying concepts from biology, ecology, chemistry and atmo- spheric sciences. Students will further investigate this extremely important issue.
Global Warming
Make sure students understand the greenhouse effect by working through the diagram in this Figure with the class.
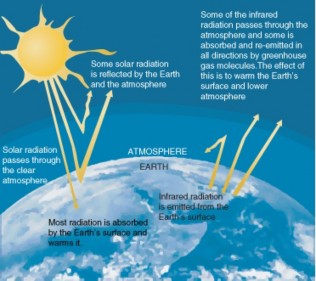
Discuss how the greenhouse effect is related to global warming. Specifically, discuss the following points:
What is the greenhouse effect?
The greenhouse effect is a natural consequence of Earth’s atmosphere. Why?
Without the greenhouse effect, Earth’s average temperature would be much lower. Why?
Changes in Earth’s atmosphere (especially increased CO2) have increased the green- house effect and Earth’s average temperature. How?
Have students continue this analysis with further research on this or a related topic. Students should research the literature, analyzing data that they find and communicate their findings to the class. Aspects of the greenhouse effect that may be further investigated include:
potential issues for plants and animals associated with this effect
any relationship between the greenhouse effect and global warming
potential effects of global warming.
- Log in or register to post comments
- Email this page